

June Charts of Interest: Are Happy Days Here Again?
by Charles Rotblut | June 22, 2023
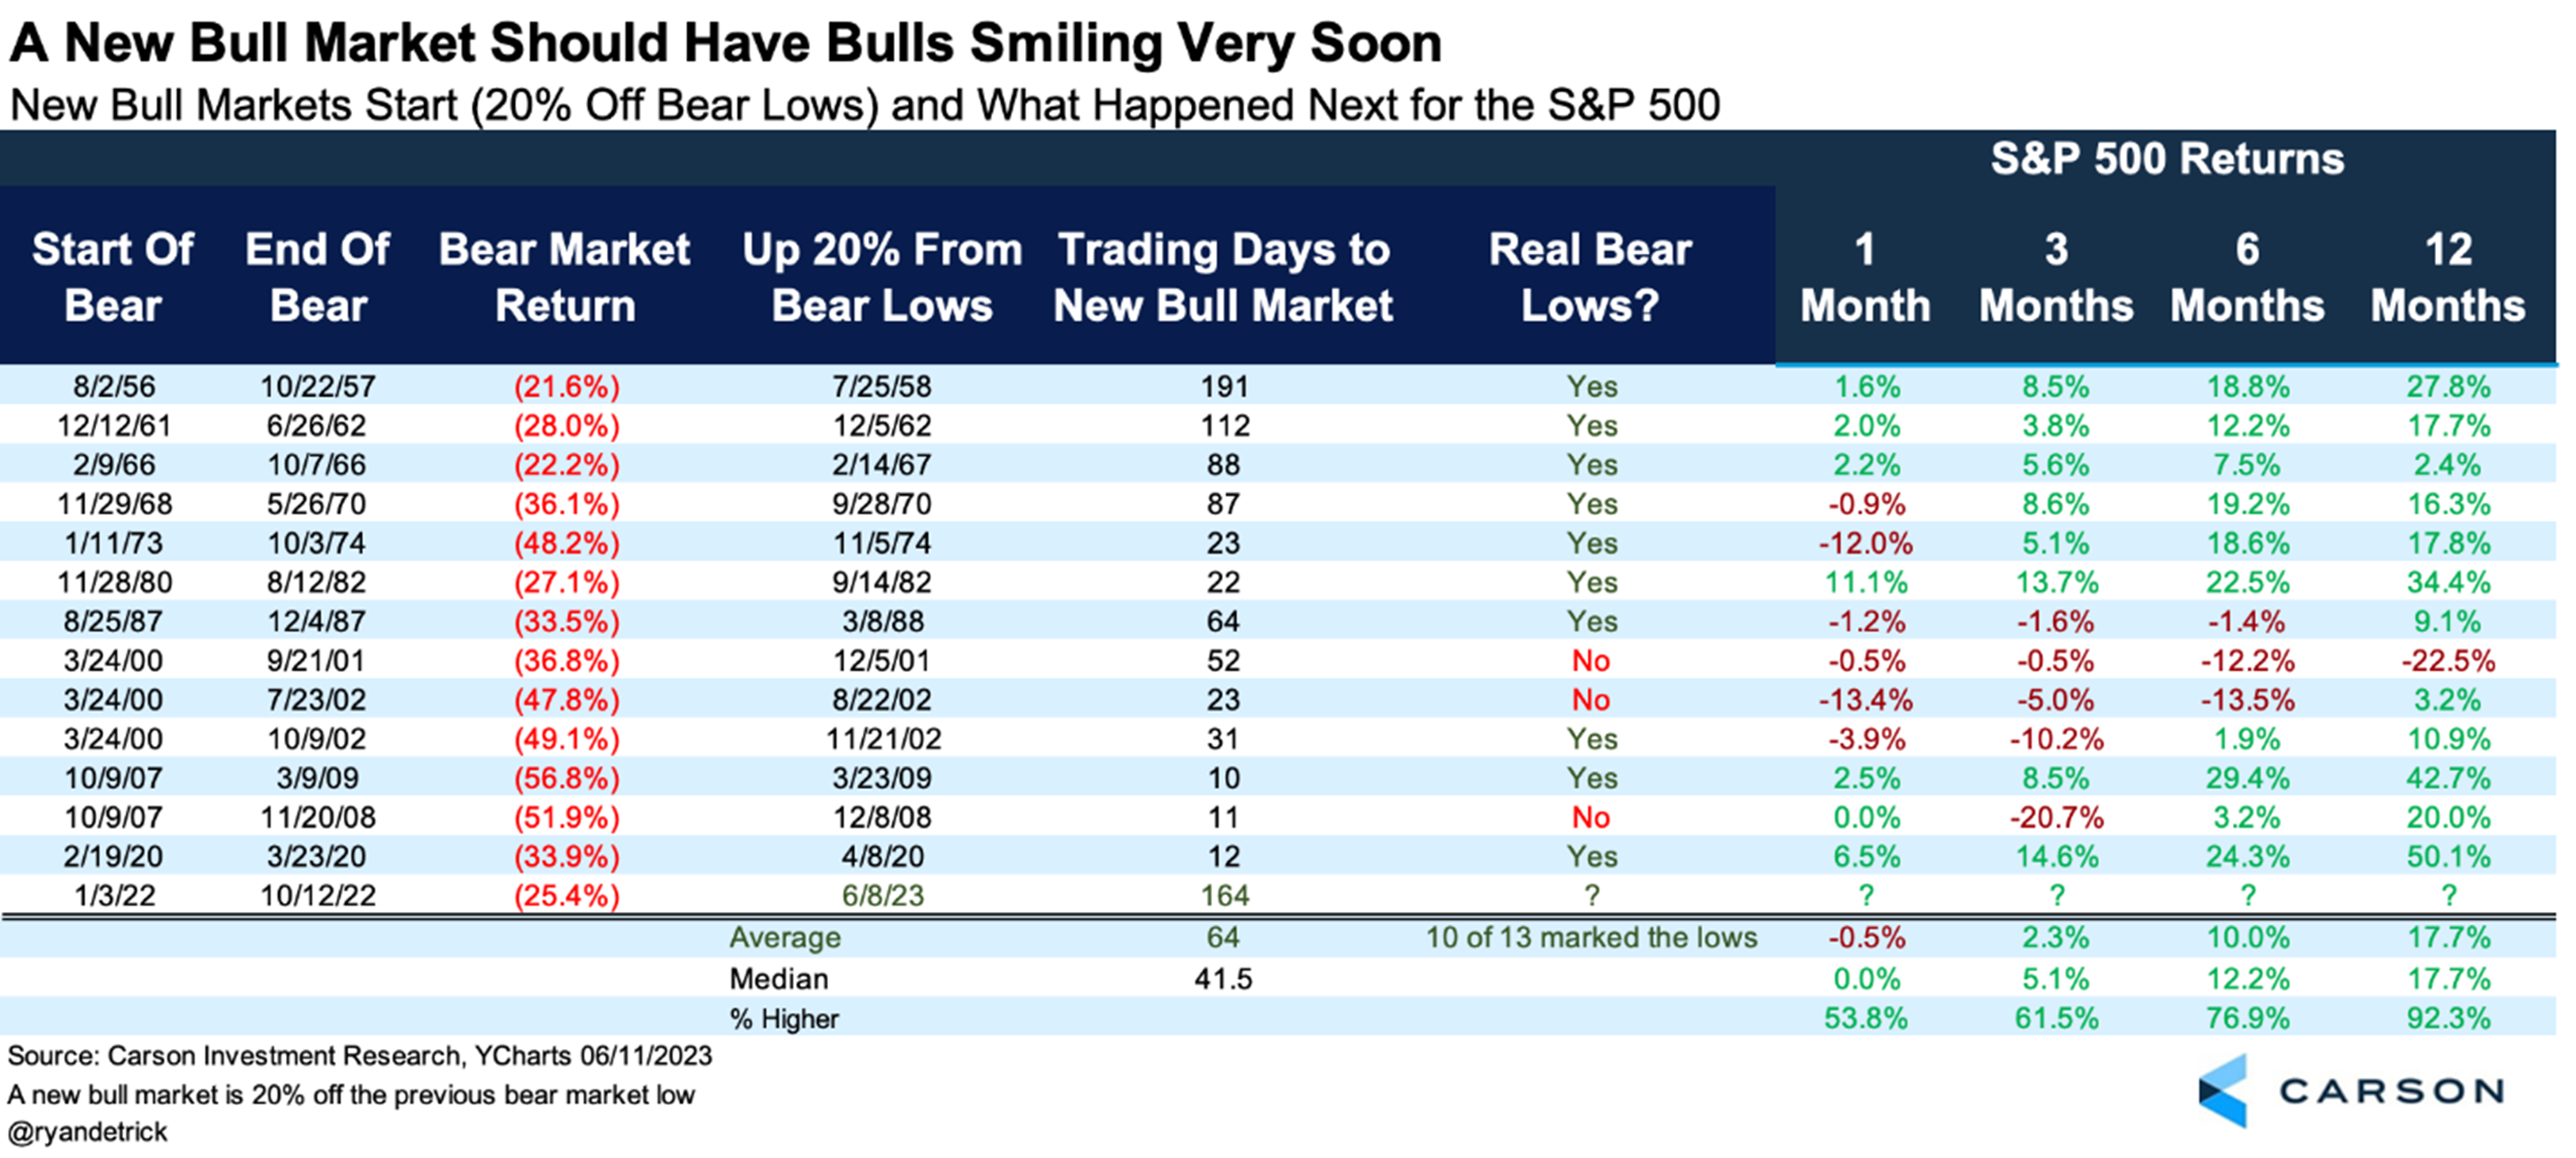
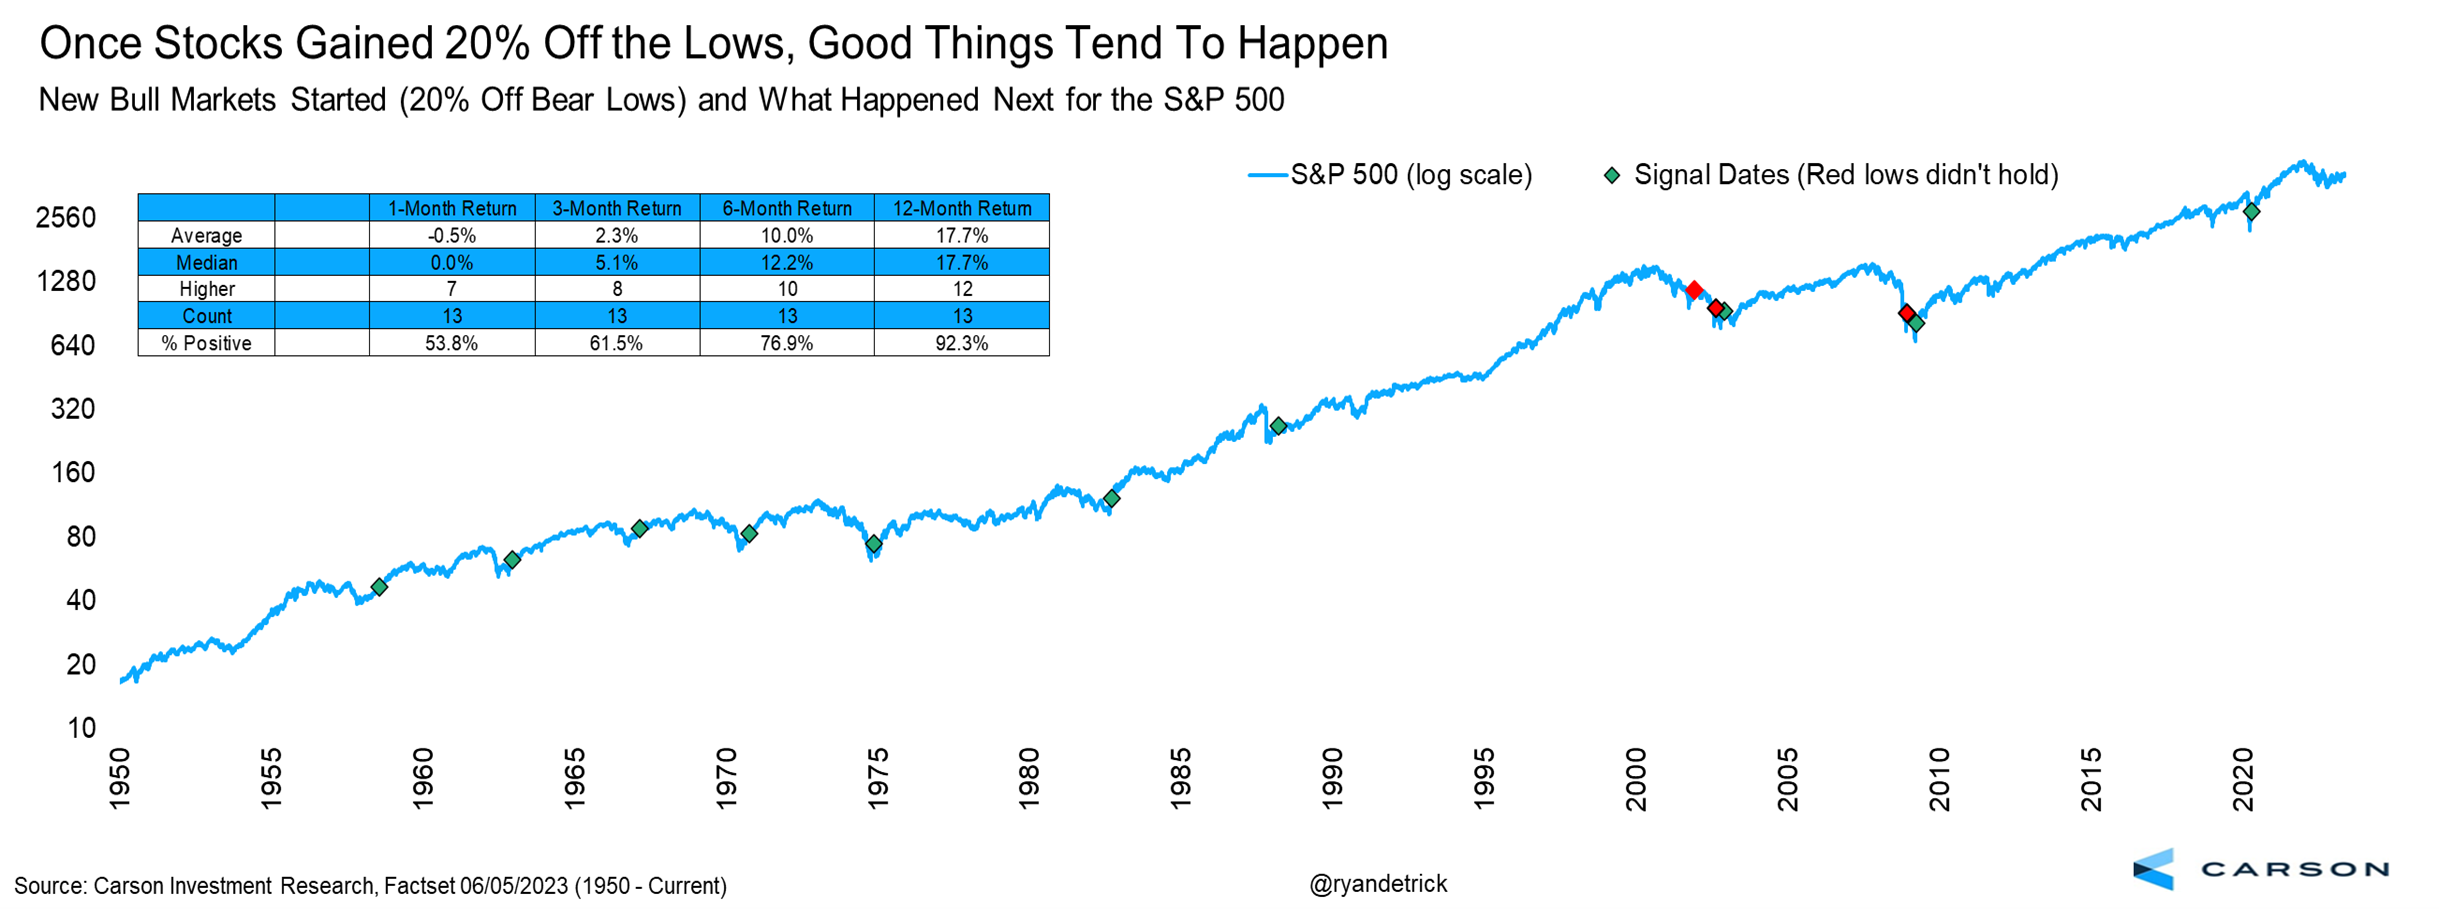
The S&P 500 index entered a new bull market on June 8, 2023. So not surprisingly, I’m going to start this month’s charts of interest by addressing the question of what happens next. Historically, good things tend to happen.
Here’s what Carson Group chief market strategist Ryan Detrick tweeted in early June: “S&P 500 just points away from a ‘new bull market’ and up 20% from the Oct lows. What happens next? 13 times stocks 20% off lows and a yr later higher 12 times and up 17.7% on avg. 6 mos later up 10% on avg.”
A Bull Without Much Breadth
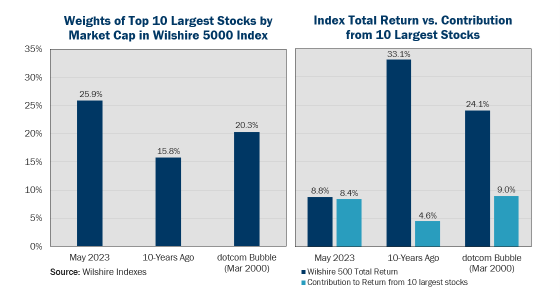
One thing we at AAII, as well as others, have noticed is the lack of widespread participation in the bull market. Rather, the S&P 500’s emergence into a bull market has been fueled by a small group of stocks. This lack of breadth can be observed in other market indexes as well.
“At the end of May, the footprint of the biggest ten companies in the Wilshire 5000 Index stood at nearly 26%, considerably higher than the 15.8% weight the ten largest stocks had a decade ago, and surpassing even the lopsidedness of the market at the height of the Dot Com bubble in 2000,” noted Rayliant’s Phillip Wool last week. He then added, “Over the last decade, a little more than one-eighth of the market’s performance was contributed by the largest firms. During the late-90s tech bubble, over one-third of returns came from these megacap stocks. In the recent bull run, by contrast, almost the entire market return was accounted for by just ten companies’ performance.”
Source: Rayliant Global Advisors.
One More and Then Done?
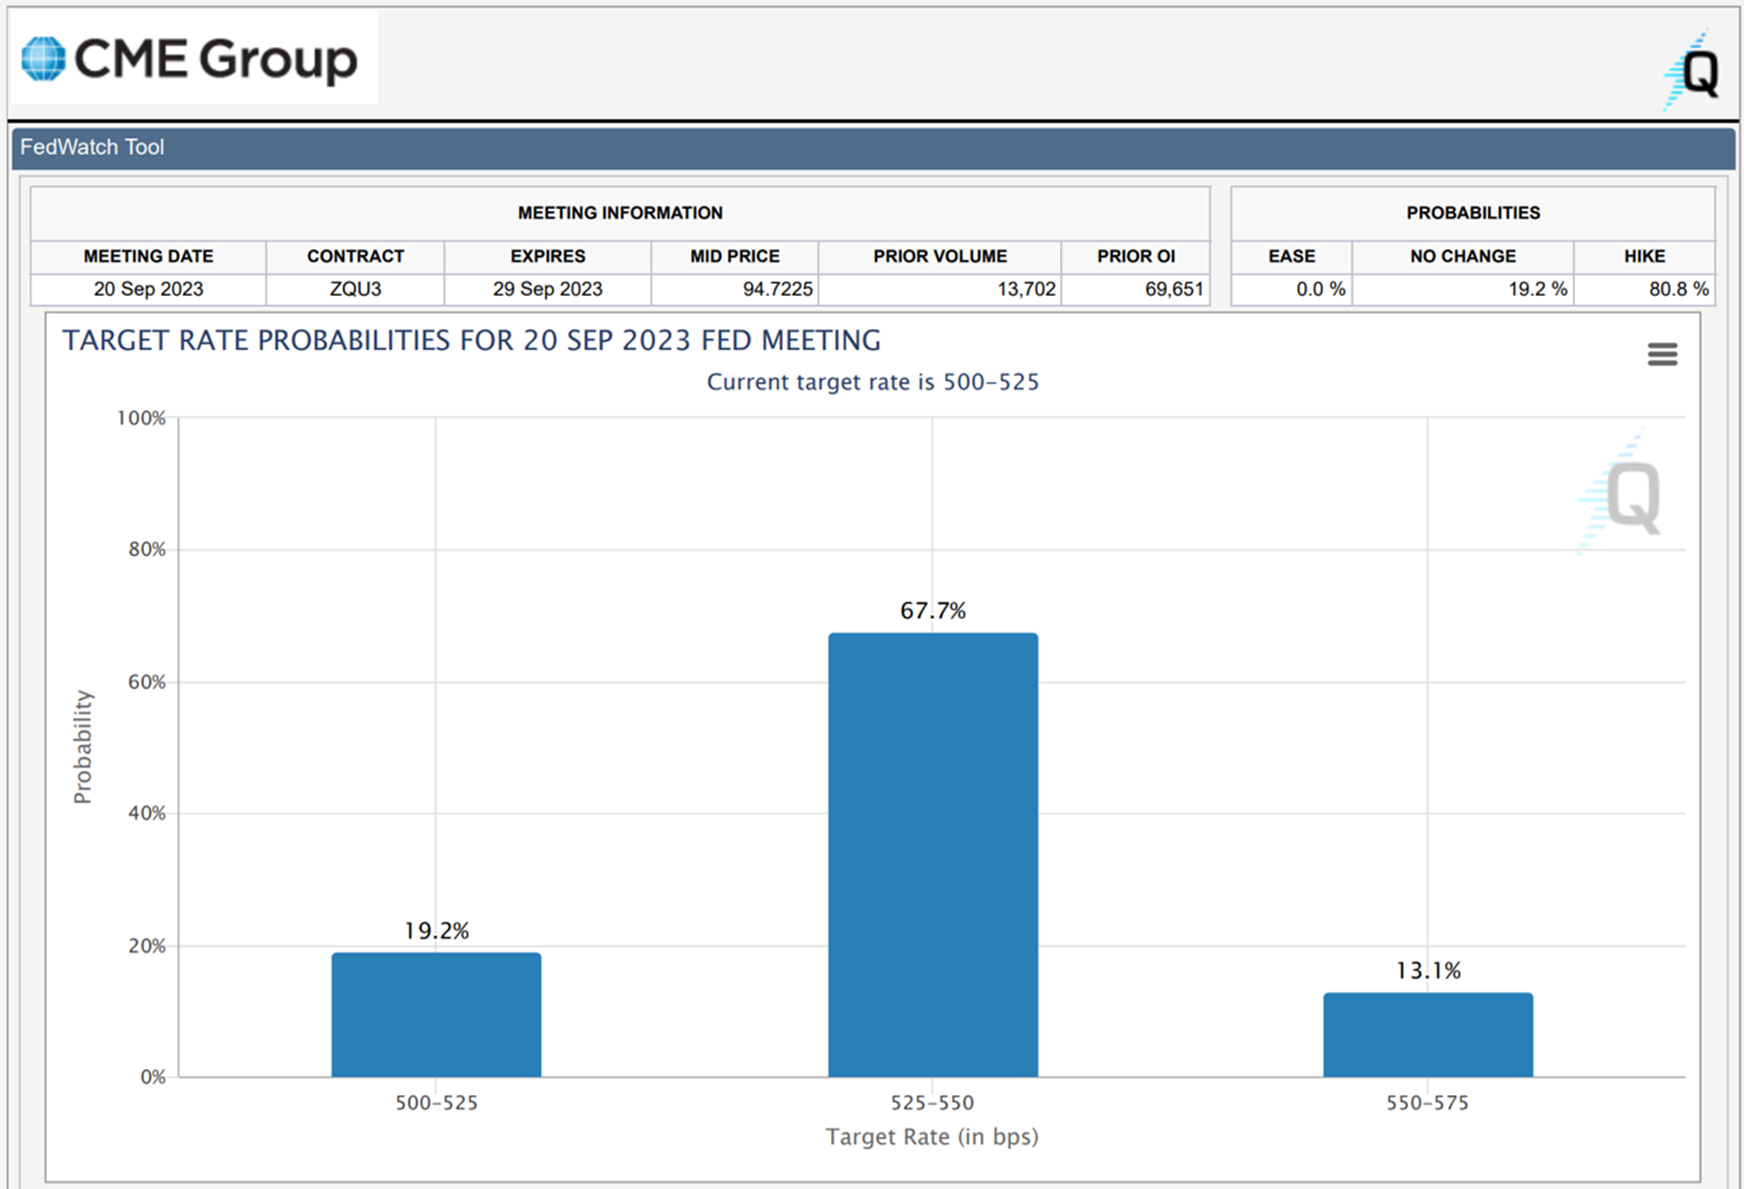
Last week’s decision to pause interest rate increases is being viewed as the beginning of the end to the current interest rate hike cycle. The federal funds futures market is expecting the Federal Open Market Committee (FOMC) to raise interest rates by a quarter point (0.25%) at its July 2023 meeting. Afterward, no more hikes are expected to occur.
Here are the expectations that the CME FedWatch Tool is showing being priced in for the September FOMC meeting as of Thursday morning. The odds of where traders expect interest rates to be at the end of the year are not significantly different. As always, these odds are subject to change.
Add TIPS to the List of Things Investors Stink at Timing
There has long been evidence about investors making poor decisions when it comes to timing the stock market. New data from Morningstar shows that investors also tend to make ill-timed buy and sell decisions when it comes to Treasury inflation-protected securities (TIPS).
Morningstar analyzed asset and flow data for TIPS funds over a 10-year period ending on April 30, 2023. In summarizing the findings, Morningstar Research chief ratings officer Jeffrey Ptak, CFA, wrote, “We found the average dollar invested in TIPS funds lagged the total return of the average TIPS fund by at least 2% per year.” Ouch!
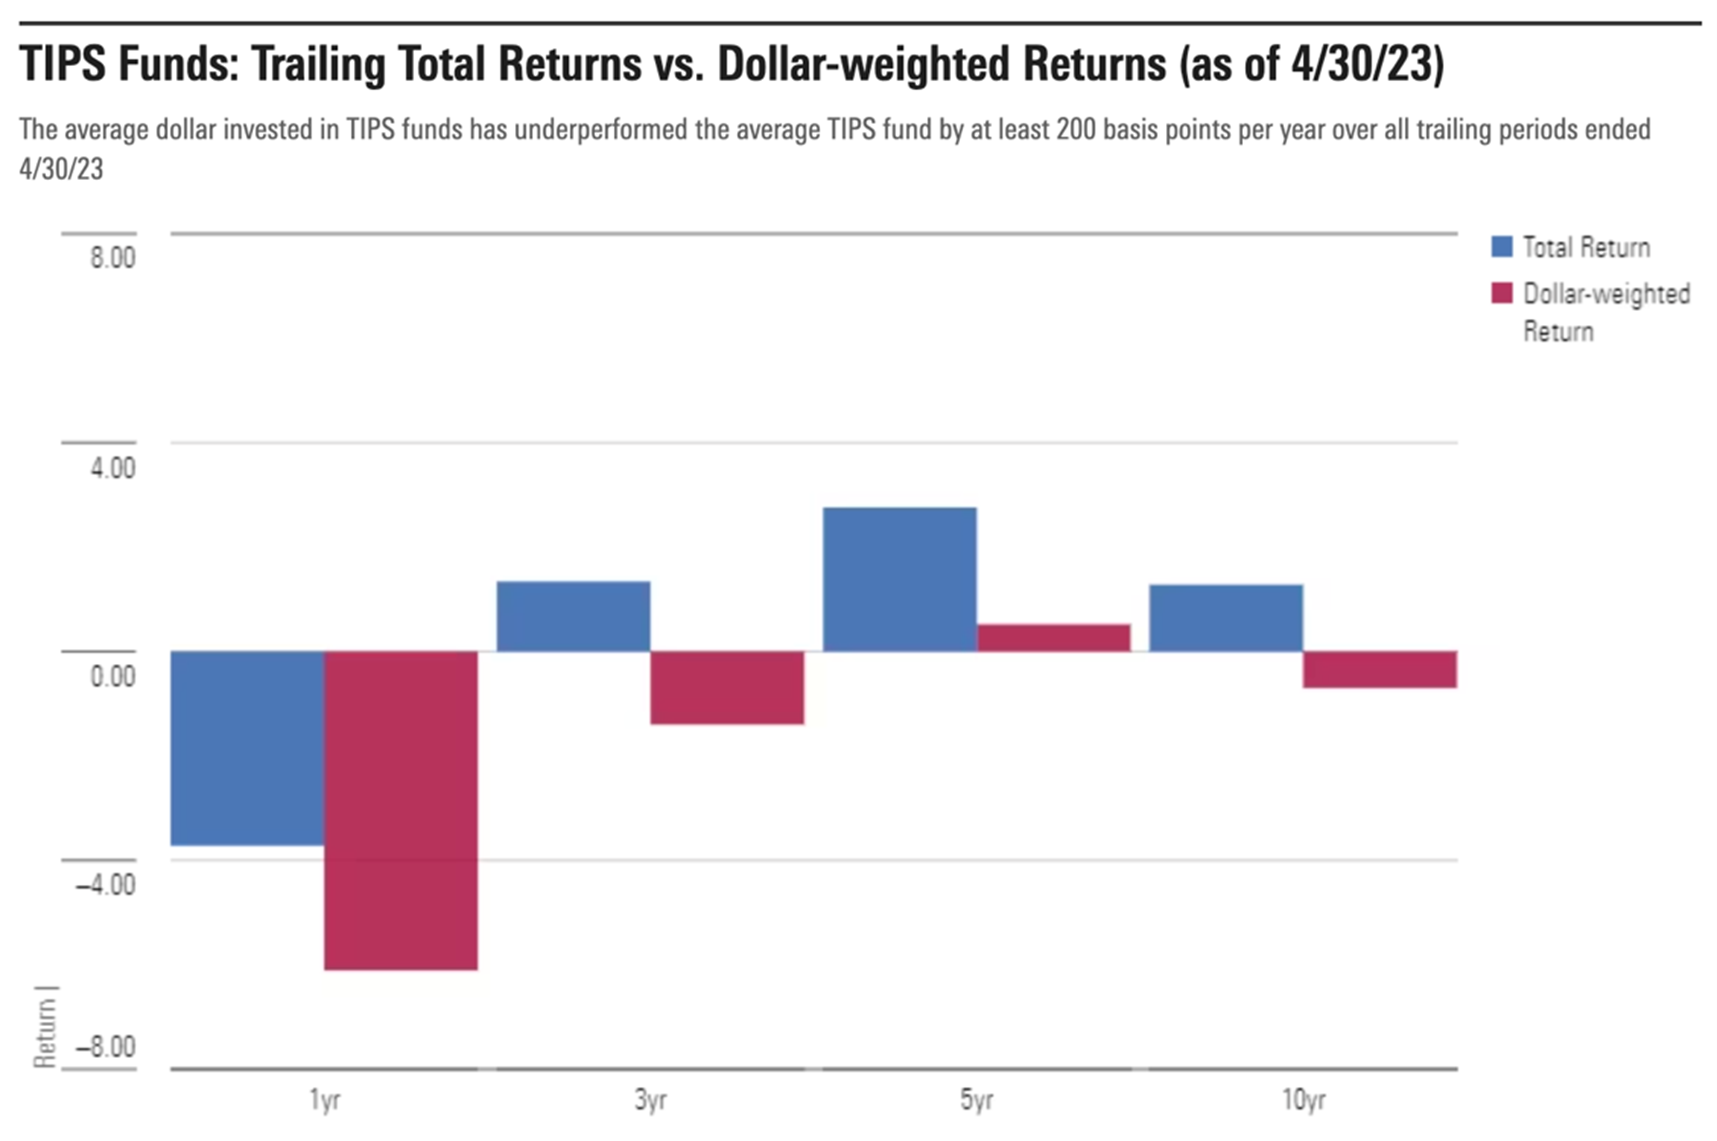
Source: Morningstar.
Not Always Forever
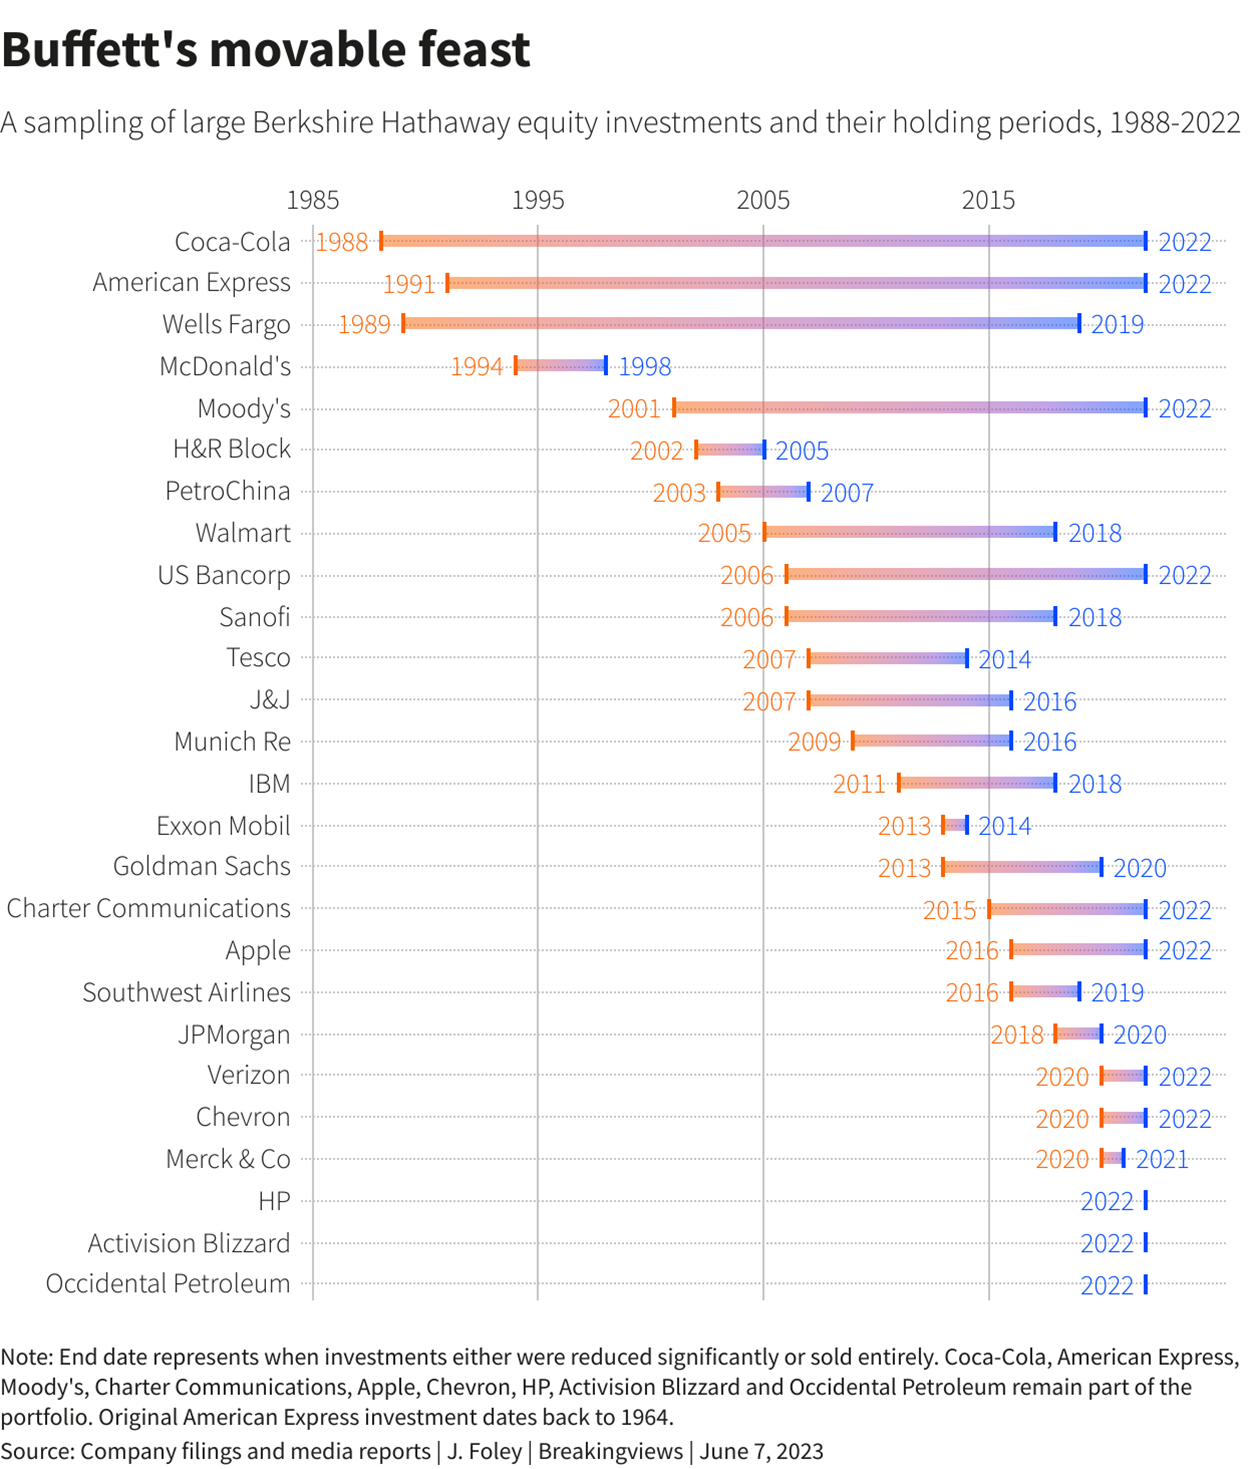
While Warren Buffett is known for having said, “Our favorite holding period is forever,” his company’s portfolio of marketable securities does experience regular turnover. Here’s a chart from Reuters showing the holding periods for several current and former securities held by Berkshire Hathaway Inc. (For disclosure purposes, I am a Berkshire Hathaway shareholder.)
So, You Do Like Stocks After All?
Last month, I included a chart from a Gallup poll showing that the percentage of people who thought stocks were the best long-term investment was “on the low end of the 17% to 27% range of Americans choosing it since 2011.”
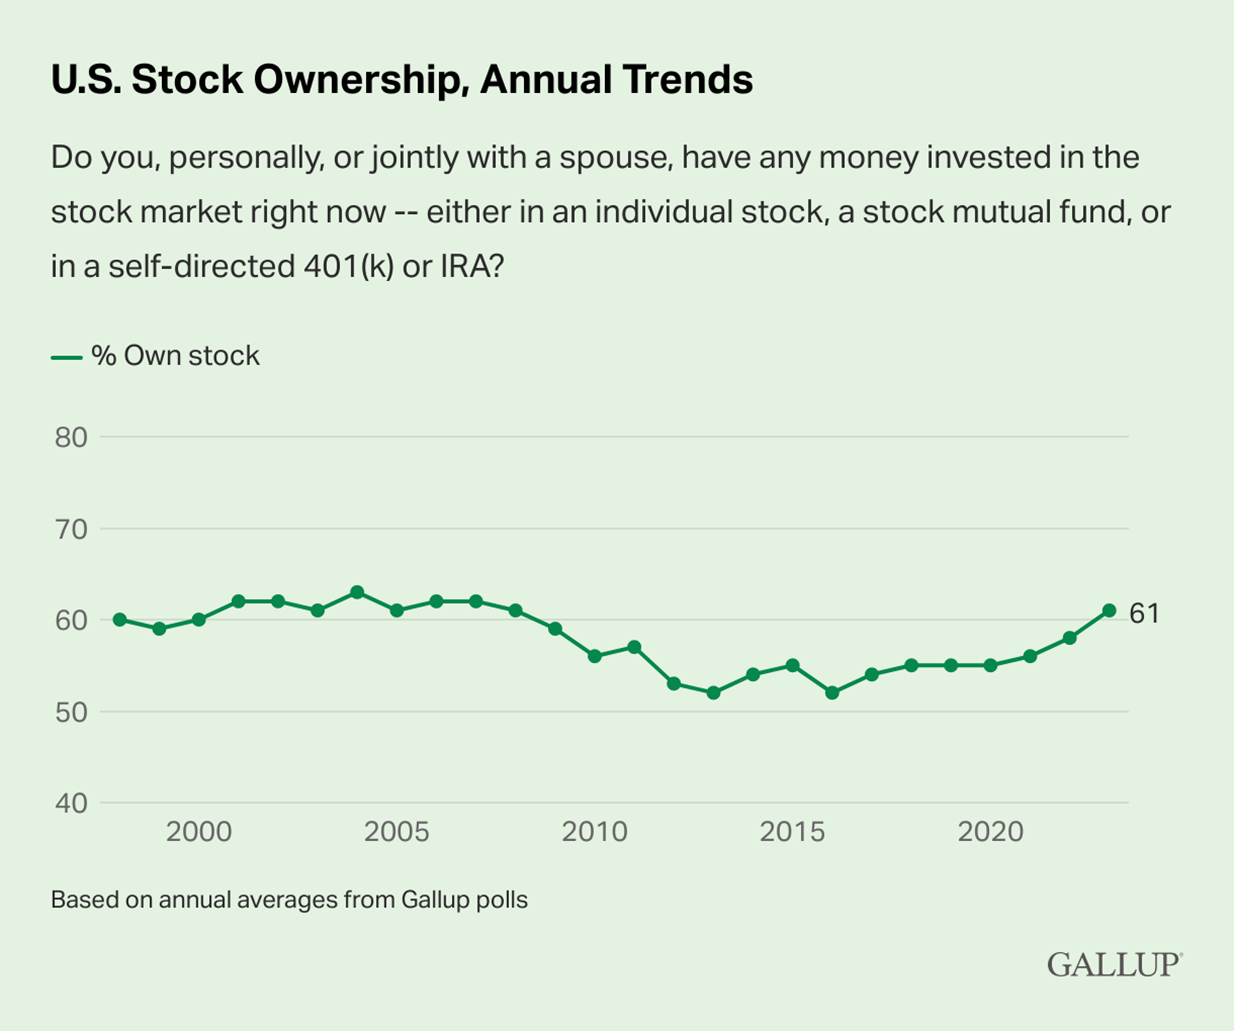
Well, at the end of May, Gallup published a new survey showing 61% of Americans owning stocks. This was “the highest percentage Gallup has measured since 2008.”
Gallup did not provide an explanation reconciling the two results. It did elaborate on the findings of the more recent survey by saying, “Stock ownership rates are now back to where they were in 2008, likely because stocks have again proven to be a solid long-term investment and income gains among Americans have given them greater means to invest in stocks.”
Make Sure You Didn’t Leave a Retirement Account at a Former Employer
Rollover firm Capitalize says nearly 3.8 million 401(k) accounts were left behind in 2021 and another 4.4 million were left behind in 2022 by people who changed jobs or otherwise left their employer. “These numbers suggest that one in five job-changers with a 401(k) left that account behind when changing jobs during 2021 and 2022.”
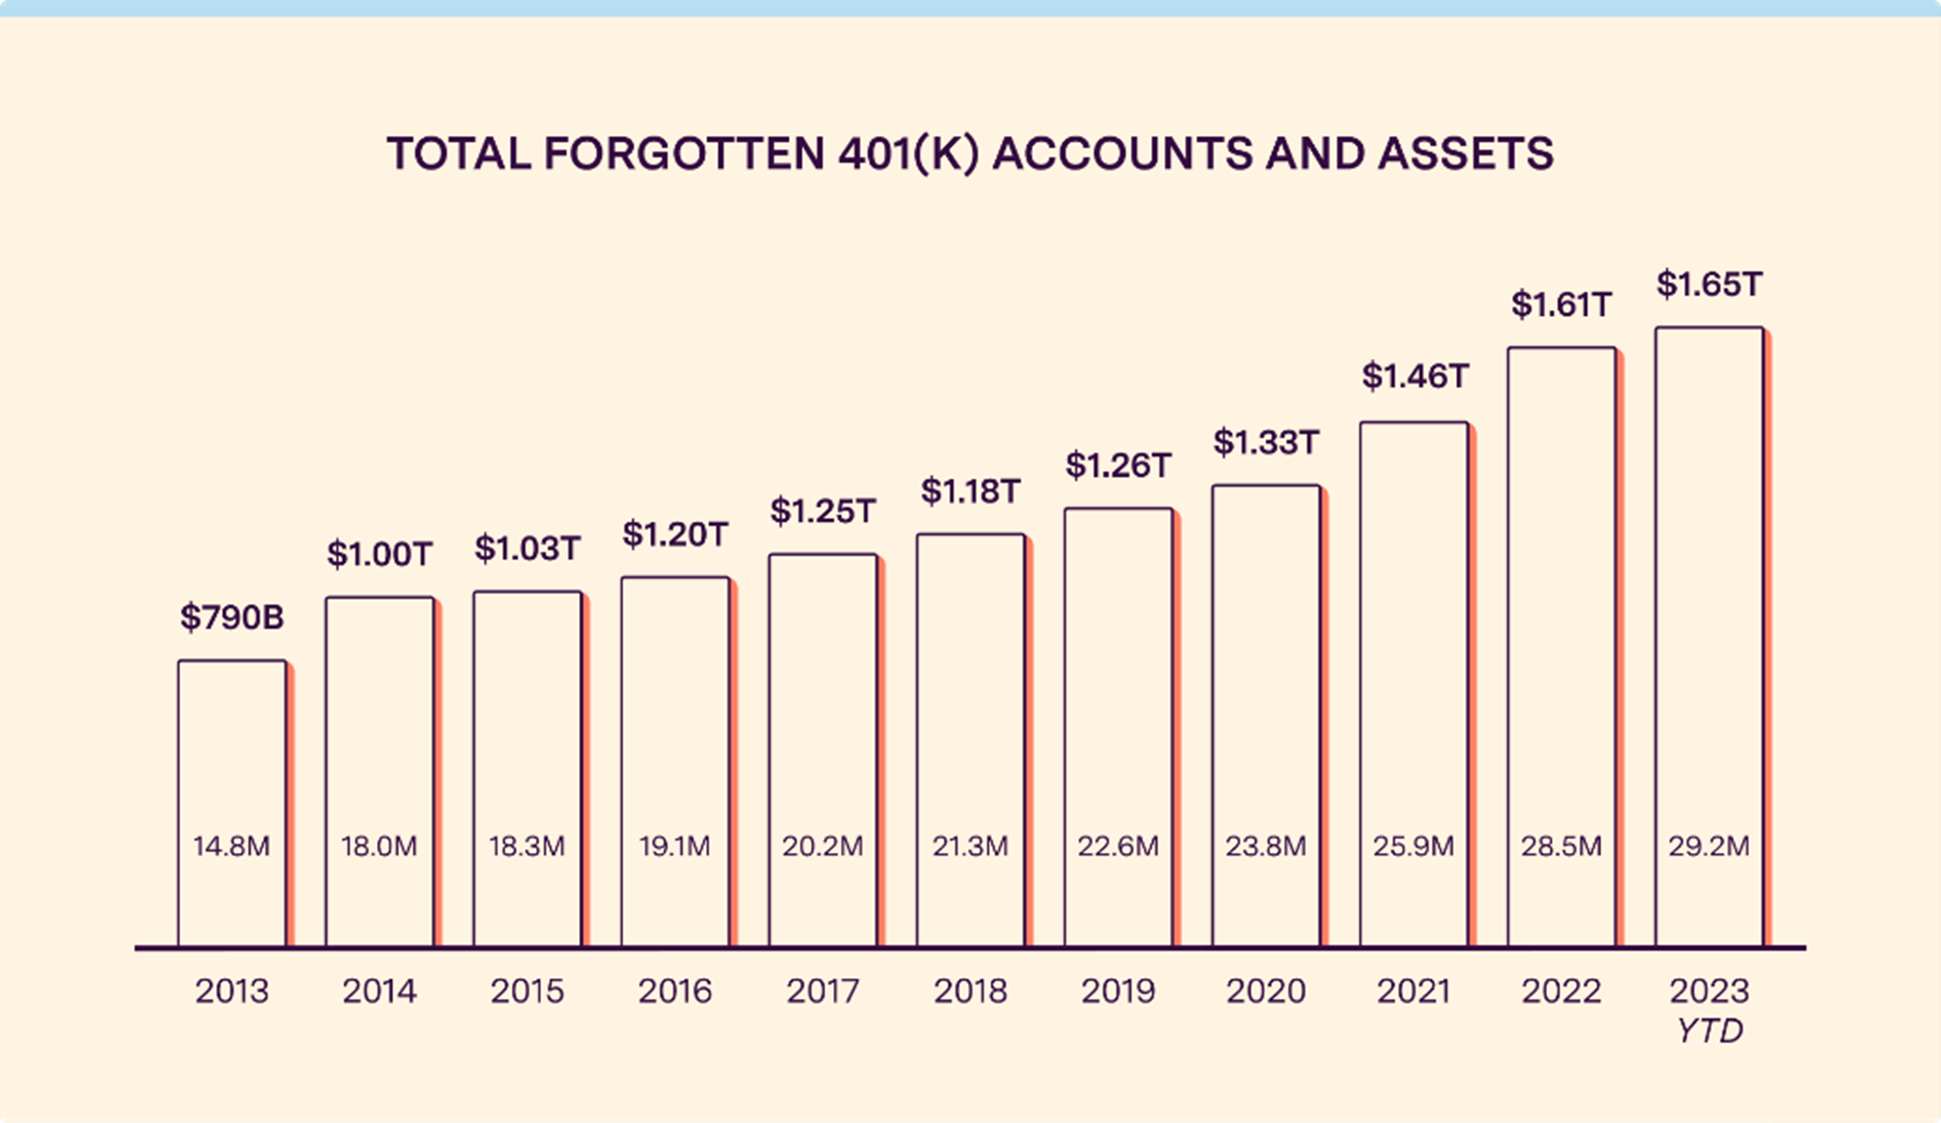
Source: Capitalize.
A provision in the SECURE 2.0 Act mandates the U.S. Department of Labor (DOL) to create a searchable online database for retirement accounts with low funds. In the meantime, if you think you might have a retirement account that was abandoned, you can try checking Missing Money. You can also try contacting your former employer and/or the mutual fund company that provided the offerings for your plan.

-
Tracking the Market’s Expectations for Interest Rate Hikes
How we follow the CME FedWatch Tool to gauge expectations for monetary policy. -
Tips About Treasury Inflation-Protected Securities
TIPS can be useful in protecting against unanticipated inflation, although they do not eliminate interest rate risk entirely. -
Comparing and Contrasting Real Estate Funds
Mutual funds and ETFs provide a low-cost entry point to real estate and allow investment in a variety of real estate markets. -
Timing the Market Using Factors
An AQR Capital Management study suggests that in addition to traditional price momentum, capturing the momentum of characteristic-based factors may boost returns. -
Should Young People Still Save for Retirement?
In her latest My Investing Discoveries blog post, Anine Sus looks at an alternative view of when to start contributing to a retirement plan.
Members are looking for your input. Can you help with this question from the Stock Screening Community?
“In your opinion, how does the Value on the Move—PEG With Estimated Growth screen compare to other screens or strategies you have used in the past to identify growth stocks? Are there any alternative approaches you believe are more effective in finding growth stocks at a reasonable price?”
Tap the button and then choose the Join the Community button on the right to answer this question in the AAII Community
Answer This Question in the AAII Community »
AAII Sentiment Survey
Optimism slightly decreased but remains above average for the third consecutive week in the latest AAII Sentiment Survey. Neutral sentiment decreased, while bearish sentiment increased from its lowest level since July 2021 last week.
Bullish sentiment, expectations that stock prices will rise over the next six months, decreased 2.3 percentage points to 42.9%. This puts optimism above its historical average of 37.5% for the third consecutive week.
Neutral sentiment, expectations that stock prices will stay essentially unchanged over the next six months, decreased 2.7 percentage points to 29.4%. Neutral sentiment is below its historical average of 31.5% and is at a six-week low.
Bearish sentiment, expectations that stock prices will fall over the next six months, increased 5.1 percentage points to 27.8%. At three consecutive weeks, this is the longest streak that pessimism has been below 30% since a five-week streak in October and November 2021.
The bull-bear spread (bullish minus bearish sentiment) decreased to 15.1%, down 7.4 percentage points. The bull-bear spread has been above its historical average of 6.4% for three consecutive weeks.
This week’s special question asked AAII members what they thought about the Federal Reserve’s decision to pause interest rate hikes. Here are the responses:
- Pausing was the right decision: 67.7%
- They should have raised interest rates: 24.5%
- They should have cut interest rates: 2.5%
- Not sure/no opinion: 5.1%
Bullish: 42.9%, down 2.3 points
Neutral: 29.4%, down 2.7 points
Bearish: 27.8%, up 5.1 points
Bullish: 37.5%
Neutral: 31.5%
Bearish: 31.0%
See more Sentiment Survey results.

June 15, 2023 The Fed Pauses, Plus William O'Neil and the CAN SLIM Strategy
June 8, 2023 A New Look for AAII.com, Plus Remembering William O'Neil
June 1, 2023 When Inflation Has Outpaced Both Stocks and Bonds
May 25, 2023 VIX Trading Strategies (In Case Stocks Become More Volatile)

Discussion
DENNIS BARNES from ca posted over 3 years ago:
About that small sample size of S&P returns coming off of bear lows. How many of that small sample size (let me reiterate) were at a time when stock valuations were at very high levels and based on earnings estimates that are probably too high to begin with? As for the CME FedWatch Tool, it's always interesting to see, but, being subject to the whims of traders, its moves from day to day, week to week, can only be described as quicksilver. And, let me add, coming off of bear lows at a time when unemployment is incredibly low?
Barry from TX posted over 3 years ago:
Charles, I look forward to your monthly “All You Can Eat” schmears. Your data-based approach provides a higher degree of investor education because “independent” investors have a preference to form their own conclusions (about their own money) rather than being spoonfed a pre-packaged version of what conclusions are most useful to improve the decisions that will best direct investing objectives and risk preferences. What is the razor you use to select which data points provide the most nourishment for our hungry "independent" souls? How do the data points relate to the market zeitgeist?
Steve from Pa posted over 3 years ago:
Missing money to find lost 401k money is a rip off cost $32 and does nothing
Ric from PA posted over 3 years ago:
I don't mean to be picky, but bull and bear markets are back dated once a 20% move has occurred from a low or a high, respectively. So, on June 8, 2023, it was confirmed that a new bull market began on October 12, 2022 because there have been no lower lows since then. That makes the 'new' bull market 8 months old.
Charles Rotblut from IL posted over 3 years ago:
Barry,
I gather charts that I think are interesting and/or illustrative of what's going on in the broader financial markets and economy. What makes it in the "Charts of Interest" depends on what I come across. Since so many people, including myself, see the similar data and trends, there ends up being some type of theme with several of the charts shown.
-Charles
You need to log in as a registered AAII user before commenting.
Create an account