

The State of the U.S. Financial Markets as of Midyear 2023
by Charles Rotblut | July 06, 2023
The headline numbers for the first half of the year look pretty, pretty good. The S&P 500 index rebounded by 16.89%. Yields on the benchmark 10-year Treasury note are essentially unchanged after having more than doubled last year.
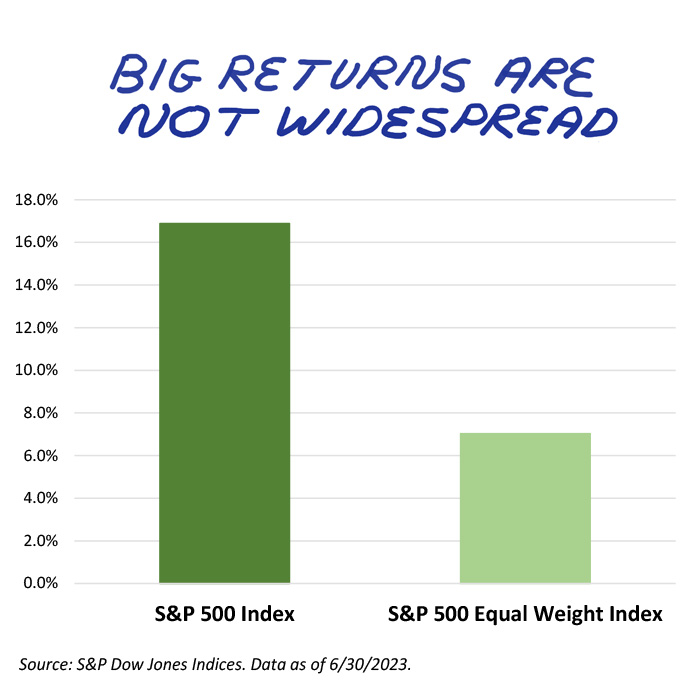
What the headline numbers indicate and what is occurring beneath the surface isn’t always the same.
Consider stocks. The S&P 500 Equal Weight index’s return for the first half of the year is 7.03%. This is good, but still less than half that of the S&P 500. The same stocks are in both indexes, only the weightings differ. The S&P 500 is a market-capitalization-weighted index, meaning larger stocks have more influence on its returns. The S&P 500 Equal Weight seeks to weight each stock equally.
A similar breadth issue exists in the Russell indexes. The Russell 1000 index had a year-to-date return of 16.68% as of June 30. The Russell Top 50 Mega Cap index jumped by 27.82% over the same period.
Small-cap stocks, meanwhile, have not kept up the pace. The Russell 2000 index rose by 8.09% over the same period.
Even with this year’s rebound, the Russell 2000 has yet to experience a 20% rebound from its bear market lows. This type of rebound is required before the small-cap index is officially in a new bull market. Since it has yet to happen and thereby confirm the participation by a broader set of stocks, we at AAII have postponed calculating new bull market returns for the AAII Stock Screens.
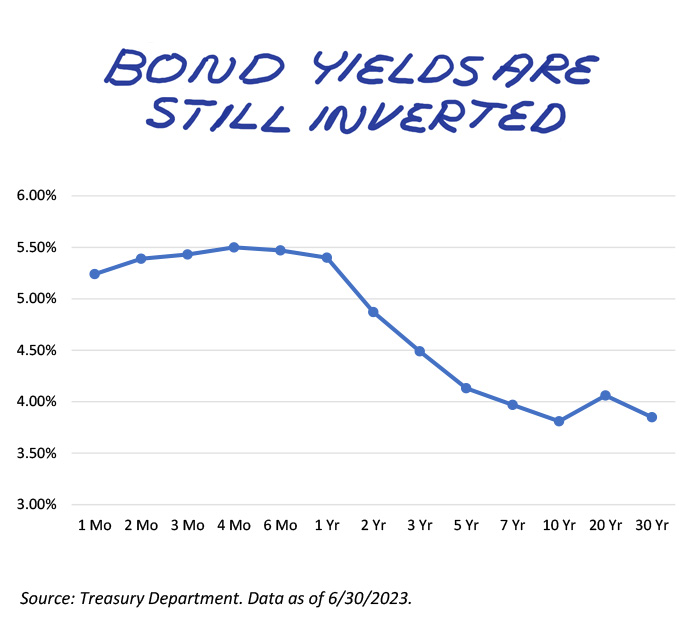
On the bond side, yields are continuing to rise at the short end of the curve. The six-month Treasury bill yielded a juicy 5.47% at the end of June. This compares to 4.76% on December 30, 2022.
Perhaps more importantly, the yield curve remains very inverted. Three-month bills were yielding 5.43% on June 30, versus 4.13% for the five-year note and 3.81% for the 10-year note. (Under normal market conditions, yields rise as maturities lengthen.) Inverted yield curves have historically been harbingers of forthcoming recessions.
The Federal Reserve has a lousy record of achieving economic soft landings. Despite this, the economy has expanded for three consecutive quarters. The Atlanta Federal Reserve’s GDPNow calls for the U.S. economy to have grown again in the second quarter. Still, should a recession occur as the result of rate hikes and inflation, it would be the most anticipated recession in recent history.
So, what are the takeaways for long-term investors? Here are a few of my thoughts:
- Headline numbers often don’t tell the full story. The S&P 500 may be the most followed market benchmark, but its performance isn’t always reflective of the broader market. We’re seeing this now with a small group of stocks driving the large-cap index’s return.
- Small-cap stocks remain historically undervalued relative to large-cap stocks. This provides opportunities for those who are patient and believe valuation spreads will again move back toward their historical averages.
- The higher yield environment creates opportunities for those of you with short-term savings, especially if you are willing to bank online.
- The financial markets reward those who are disciplined, able to stick with their strategies over the long term and aren’t swayed by short-term trends and developments.

-
Online Exclusive: Market Breadth’s Meaning for Individual Investors
Market breadth is often used by fundamental investors to help determine the most opportune time to execute a trade once a decision to buy or sell has already been made. -
Yield Curve Inverted, but Not Yet Signaling a Recession
The yield curve is a closely watched harbinger of recessions. Inverted yield curves have previously preceded most recessions over the past 50 years. -
MegaCap-8 Stocks Lead Resurgence in Large-Cap Growth
The eight so-called MegaCap-8 companies accounted for 26.4% of the S&P 500 index’s total market capitalization as of June 9, 2023. -
First-Quarter Earnings Prompt Change in Model Shadow Stock Portfolio
During the quarter, five holdings reported losses great enough to push their trailing 12-month earnings into negative territory. -
Midyear Portfolio Review and Finding an ESG Benchmark
In her latest My Investing Discoveries blog post, Anine Sus checks to see if any of her holdings need to be removed and decides on a benchmark to measure her performance against.
Members are looking for your input. Can you help with this question from the Retirement Withdrawals Community?
“In a recent AAII Journal article, Wade Pfau asserts that strategic tax planning, when combined with delayed Social Security claiming, can enhance portfolio longevity and legacy. Given your own retirement strategies, how do you perceive the trade-off between an immediate, but lower, Social Security income stream versus a delayed, but higher, income stream?”
Tap the button and then choose the Join the Community button on the right to answer this question in the AAII Community
Answer This Question in the AAII Community »
AAII Sentiment Survey
Optimism increased and remains above average for the fifth consecutive week in the latest AAII Sentiment Survey. Neutral sentiment and bearish sentiment both decreased.
Bullish sentiment, expectations that stock prices will rise over the next six months, increased 4.5 percentage points to 46.4%. This reading marks a new high for 2023. Bullish sentiment was last higher on November 11, 2021 (48.0%). Optimism is above its historical average of 37.5% for the fifth consecutive week. This has been the longest above-average streak since a five-week streak in October and November 2021.
Neutral sentiment, expectations that stock prices will stay essentially unchanged over the next six months, decreased 1.5 percentage points to 29.1%. Neutral sentiment has been below its historical average of 31.5% for the last three weeks and is at its lowest level of 2023.
Bearish sentiment, expectations that stock prices will fall over the next six months, decreased 3.0 percentage points to 24.5%. At five consecutive weeks, this is the longest that pessimism has been below 30% since a five-week streak in October and November 2021.
The bull-bear spread (bullish minus bearish sentiment) increased 7.4 percentage points to 21.9%. The bull-bear spread is above its historical average of 6.4% for the fifth consecutive week.
This week’s special question asked AAII members how their portfolio performed during the first half of 2023 relative to what they expected at the start of the year. Here are the responses:
- Better than I expected: 52.5%
- About as I expected: 25.8%
- Worse than I expected: 13.7%
- I didn’t set expectations: 7.4%
- Other/not sure: 0.6%
Bullish: 46.4%, up 4.5 points
Neutral: 29.1%, down 1.5 points
Bearish: 24.5%, down 3.0 points
Bullish: 37.5%
Neutral: 31.5%
Bearish: 31.0%
See more Sentiment Survey results.

AAII Asset Allocation Survey
Individual investors’ equity allocation reached a 13-month high last month. The June Asset Allocation Survey also shows lower fixed-income exposure and a small change in cash allocations.
Stock and stock fund allocations increased 0.8 percentage points to 66.0%. Equity allocations were last higher in May 2022 (67.1%). Additionally, this slight increase keeps stock and stock fund allocations above their historical average of 61.5% for the 37th consecutive month.
Bond and bond fund allocations decreased 0.7 percentage points to 14.1%. June marks the 28th consecutive month with fixed-income allocations below their historical average of 16.0%.
Cash allocations decreased 0.2 percentage points to 19.8%. Cash allocations are below their historical average of 22.5% for the seventh consecutive month.
Optimism in the weekly AAII Sentiment Survey has been above average for almost all of June, while pessimism has been below average and reached its lowest level since November 2021.
- Stocks and Stock Funds: 66.0%, up 0.8 percentage points
- Bonds and Bond Funds: 14.1%, down 0.7 percentage points
- Cash: 19.8%, down 0.2 percentage points
- Stocks: 34.3%, up 0.7 percentage points
- Stocks Funds: 31.7%, up 0.1 percentage points
- Bonds: 4.0%, down 0.3 percentage points
- Bond Funds: 10.1%, down 0.4 percentage points
- Stocks/Stock Funds: 62.0%
- Bonds/Bond Funds: 16.0%
- Cash: 22.0%
Take the Asset Allocation Survey.
June 29, 2023 Harry Markowitz's Lasting Influence on Investing
June 22, 2023 June Charts of Interest: Are Happy Days Here Again?
June 15, 2023 The Fed Pauses, Plus William O'Neil and the CAN SLIM Strategy
June 8, 2023 A New Look for AAII.com, Plus Remembering William O'Neil

Discussion
Barry from TX posted over 3 years ago:
Charles, after I read these monthly updates, I always feel you strive to leave your opinions at the door—on purpose -- to create room for each of us to draw our conclusions about what the data are saying to us. I respect that. That is Reason #1 I am an independent investor. My future is my responsibility. Paying someone to manage my money seems equivalent to paying someone to vote for me. So, what does a “mash-up” of these market, sentiment, and allocation data say to AAIIers? #1 Cap-weighted indexes are warped abnormally higher by the dominance of 10 or so large caps. People are riding the roller coaster to the end of the ride, which is always DOWN. #2 The AAII Sentiment Survey has shifted UP about 10% to 46% Bullish. "Sentiment" is usually considered a forward-looking indicator. Are 10% of AAIIers riding roller coasters at Coney Island this summer? #3 “Individual investors’ equity allocation is [UP] at a 13-month high last month,” over the period roughly paralleling the rise in the Fed rate increase cycle since March 2023 where interest rates have increased UP from 0% to 5%. #4 Bond allocations are DOWN about 10% to 14.1% which is a 28 MOM trend 10% BELOW the historic average at 16.0% ... despite the 5% rise [UP] in bond yields and interest rates since March 2023. #5 At this point, UP 5% higher interest rates offset inflation UP 4% producing a risk-free basis at 4%. #6 AAII portfolio asset allocations mirror this skew and are largely unchanged over more than 16 months of Fed intervention – 66% equities, 14% fixed income, and 20% cash approximating the historical 60/40 model. #7 Given this dashboard view of traffic (markets), speed (AAII sentiment), and gas (AAII allocations) of our version of “The Abilene Paradox,” I have to ask, Is the Pogo Factor operating here? Have we met the enemy? Is it us?
Eric from Michigan posted over 3 years ago:
Enjoyed this article.Your takeaways mentioned online banking. A research of the AAII website didn’t show any recent articles on the subject. Can you please direct me to any? It would be helpful to know of any other websites with such coverage. Thanks
Barry from TX posted over 3 years ago:
Eric, I hope my experiences provides some data until AAII publishes an update to their earlier articles on online accounts. I did my own research. My motivation was to be knowledgeable about these services before I recommended them to my college-age granddaughters. I opened accounts with 5 online banks and investment firms in 2021. I invested about $1,000 at each site in a savings account and brokerage account. There is a clear variation in the quality of services across firms. #1 website design is generally easy to navigate with simple, clear organized layouts. #2 They all do all their customer communications online (what else). Most force you to "chat" with someone who may or may not be a person and who may or may not be fluent in English. Some are very good at it. The big issue with “chatting” is that they are designed for trivial, routine matters. It is easy to ask questions beyond the expertise of the chatter. They do get back to you, but it may be a day later. #3 Experience with investment accounts was disappointing. I guess I expected too much. I invested $500 in "house brand" ETFs designed for "beginning investors" figuring they would try harder to please this group since it offers the potential to create long-term customers. Results to date are no better than large brokerages by enough to matter. #4 ALL actively tout "high yield" APRs on their savings accounts. Although many offer greater than 4% APR, I am earning almost 4.9% in money-market accounts at my regular brokerages ... and these funds are more liquid. I can get my cash out at the end of the day like a mutual fund. That is important with a credit crisis brewing in the background (mortgages, real estate, and small business/household loans like the runup to 2008). #5 All in all, online investing/banking comes up short of its promises. Their stock performance show this. #6 I still maintain all these accounts. They are supplementary sources for stock market data. I guess the desire NOT to have a more personal relationship with real people who have control over your cash is a generational bias with me.
You need to log in as a registered AAII user before commenting.
Create an account