

August Charts of Interest: More Costly to Finance Big Purchases
by Charles Rotblut | August 24, 2023
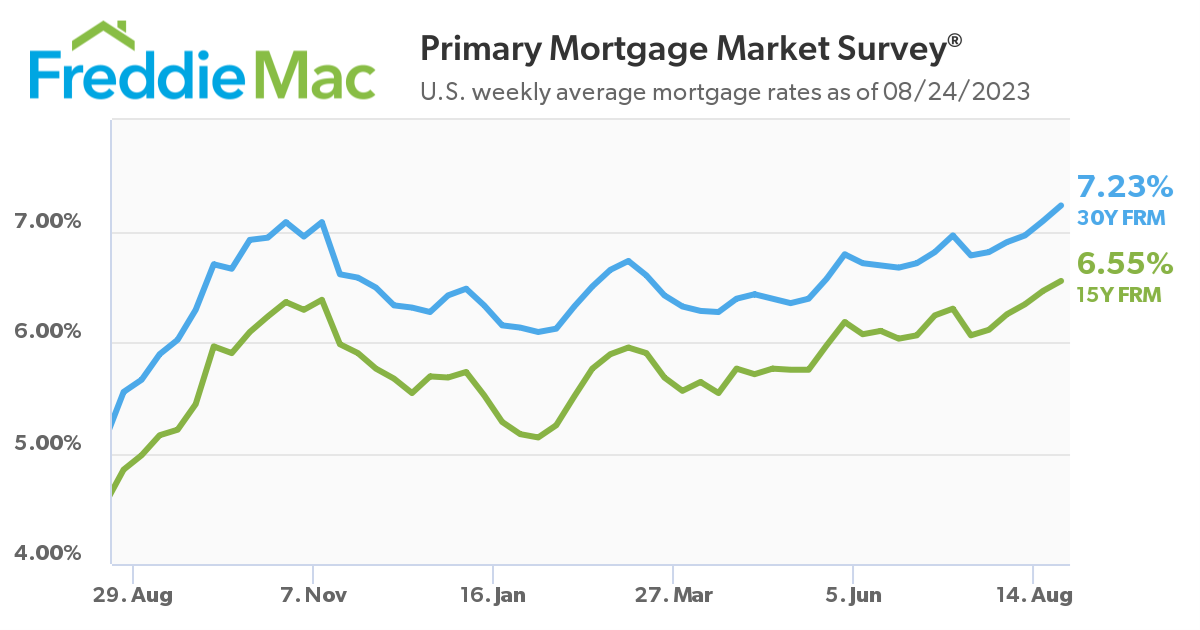
It already wasn’t easy for homebuyers, but mortgage rates have made it worse. Interest rates on a 30-year loan hit 7.23% this week. This was the highest the national average has been in 20 years according to Freddie Mac.
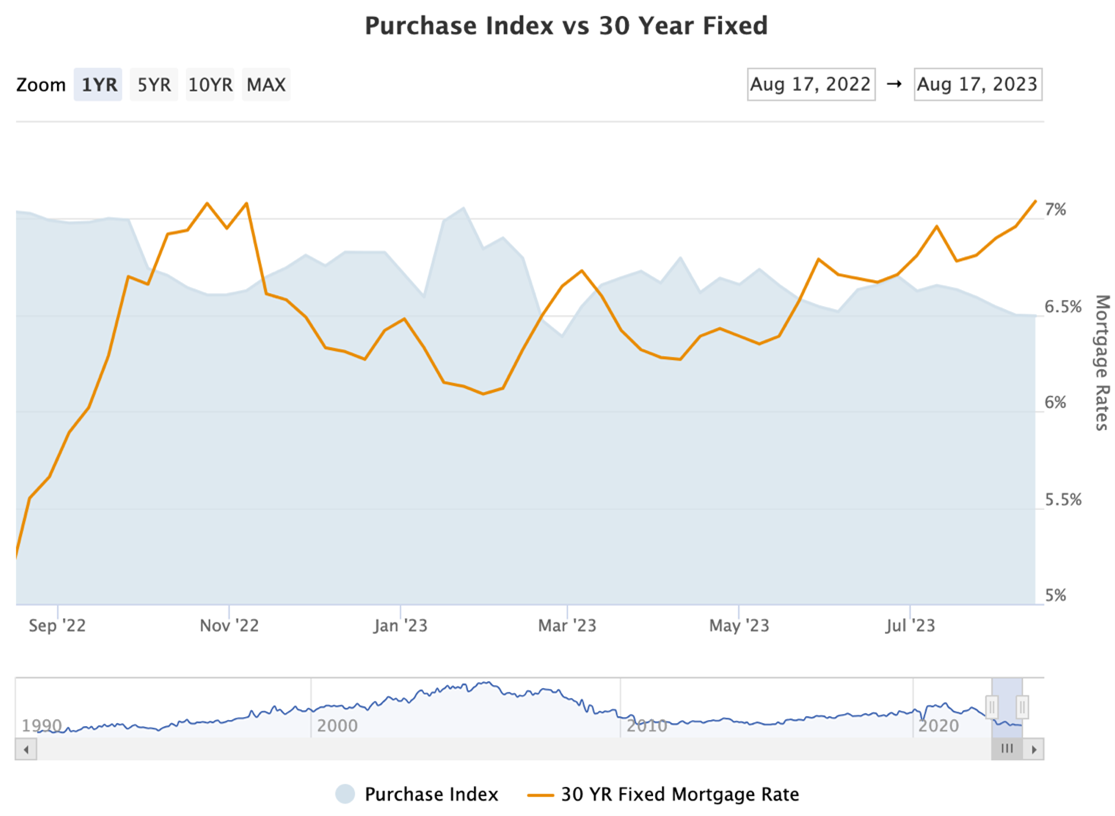
Meanwhile, and not surprisingly, demand for mortgages is declining. The blue area in this chart from Mortgage News Daily is an index of applications.
The Housing Market Isn’t Helping Buyers Either
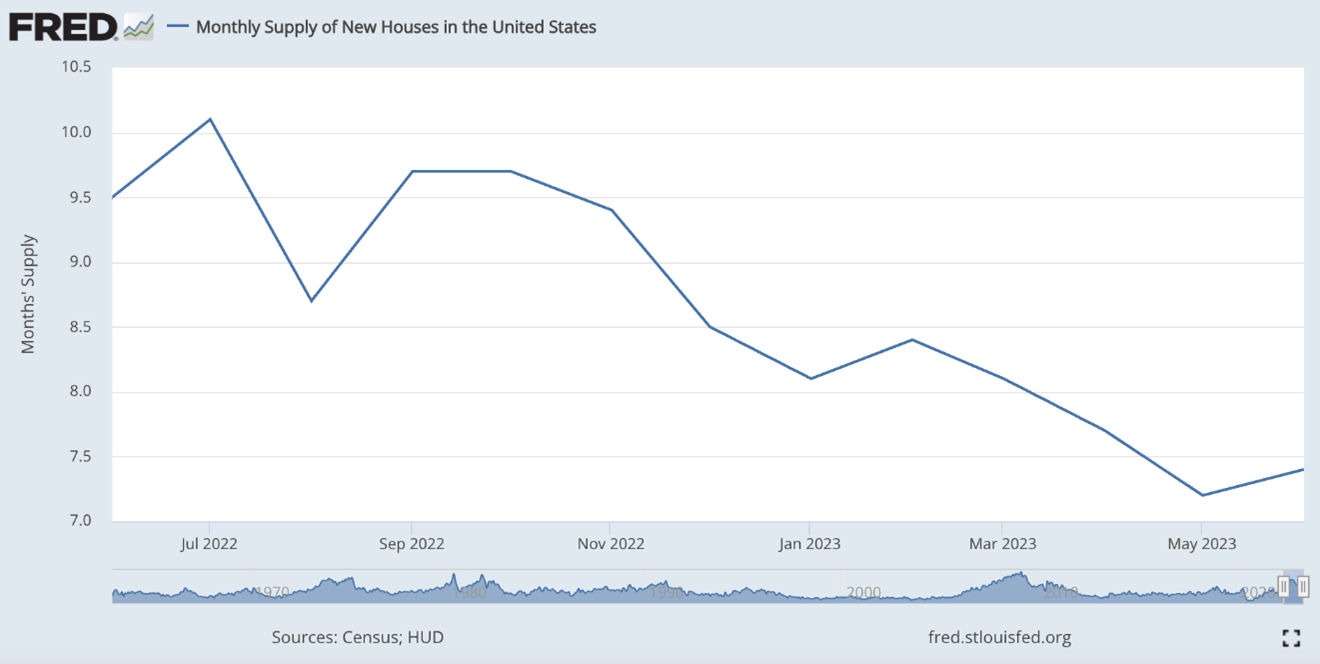
The monthly supply of new houses has declined as well. Higher mortgage rates deter current homeowners from moving since they don’t want to give up their current, much lower interest rate mortgages. In addition, permitting issues as well as land, labor and supply issues are playing a role.
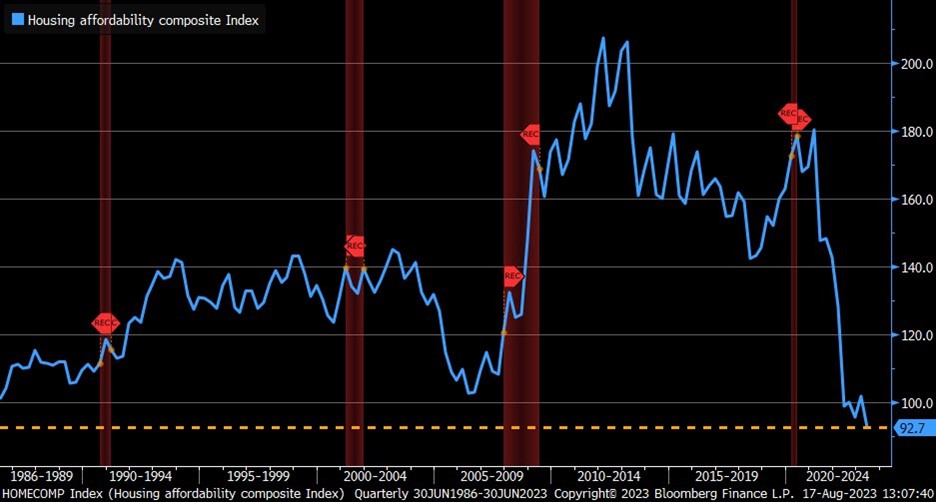
In a tweet last week, Charles Schwab’s chief investment strategist Liz Ann Sonders noted that the “Housing Affordability Index from NAR fell in 2Q to its lowest/worst on record.” NAR is the National Association of Realtors.
Automotive Financing Is More Expensive Too
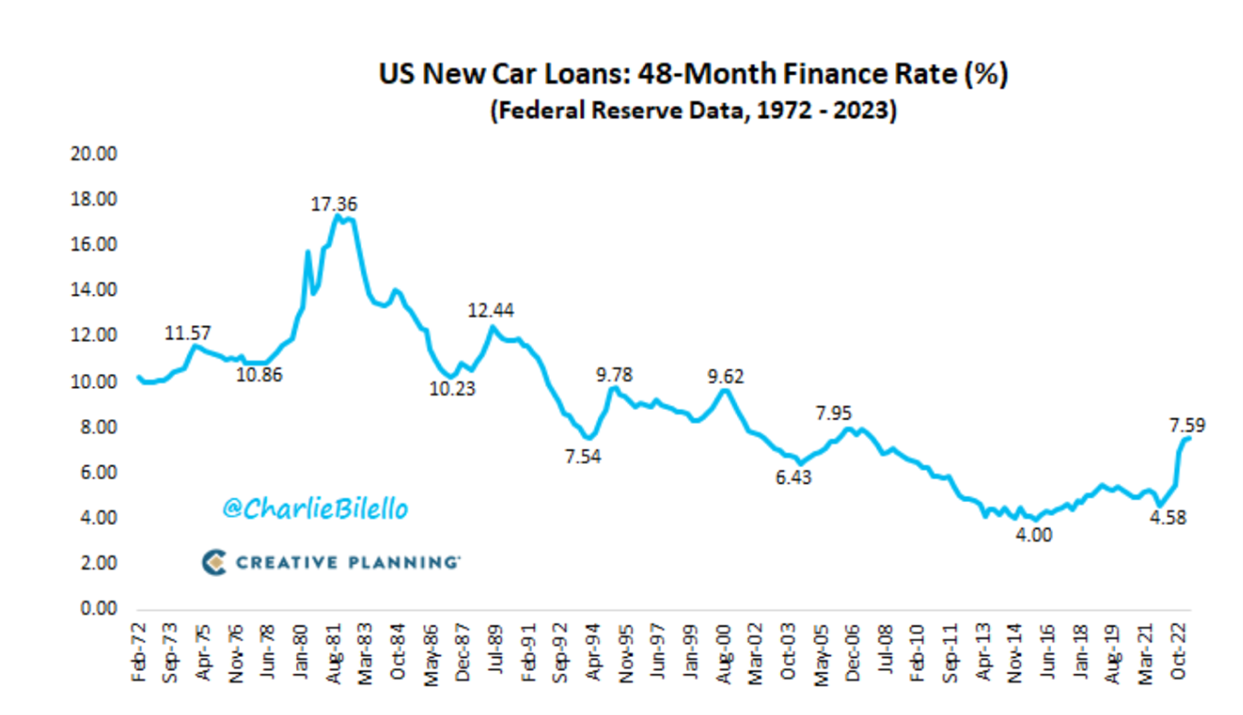
The average interest rate on 48-month new vehicle loans reached its highest level since 2007, as noted by Charlie Bilello. The 7.59% interest rate is on top of higher-priced vehicles. The Mitsubishi Mirage is now the only new car sold in the U.S. for under $20,000. (More reason to keep dragging my feet on replacing our 2010 Honda Accord and our 2011 Hyundai Santa Fe.)
What’s Bad for Spenders Can Be Good for Savers
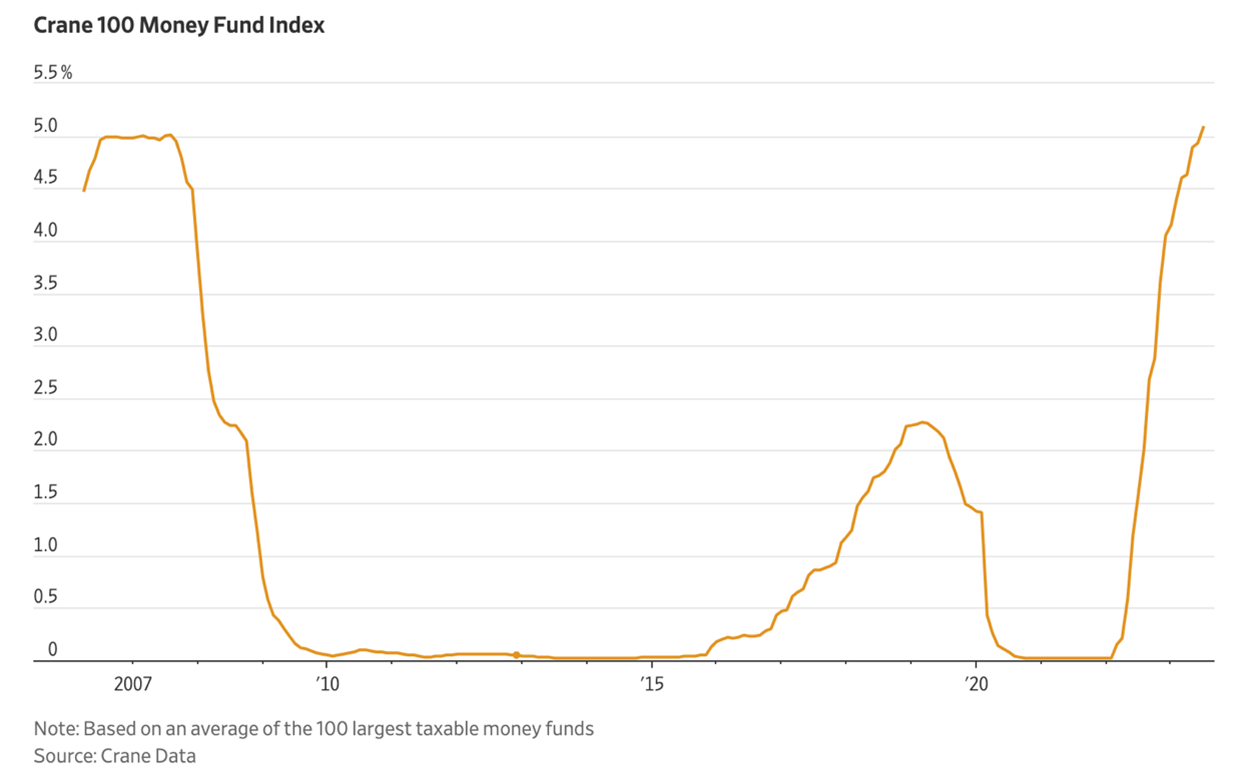
One ongoing upside to the Federal Reserve’s interest rate hikes has been juicer yields on money market funds. The average yield on the 100 largest money market funds recently reached 5.13%. This was its highest level since 2007, according to data The Wall Street Journal cited from Crane Data.
AAII members have been among those to take advantage of the higher interest rates, as we discuss in this month’s AAII Journal.

Where to Find Inflation Protection
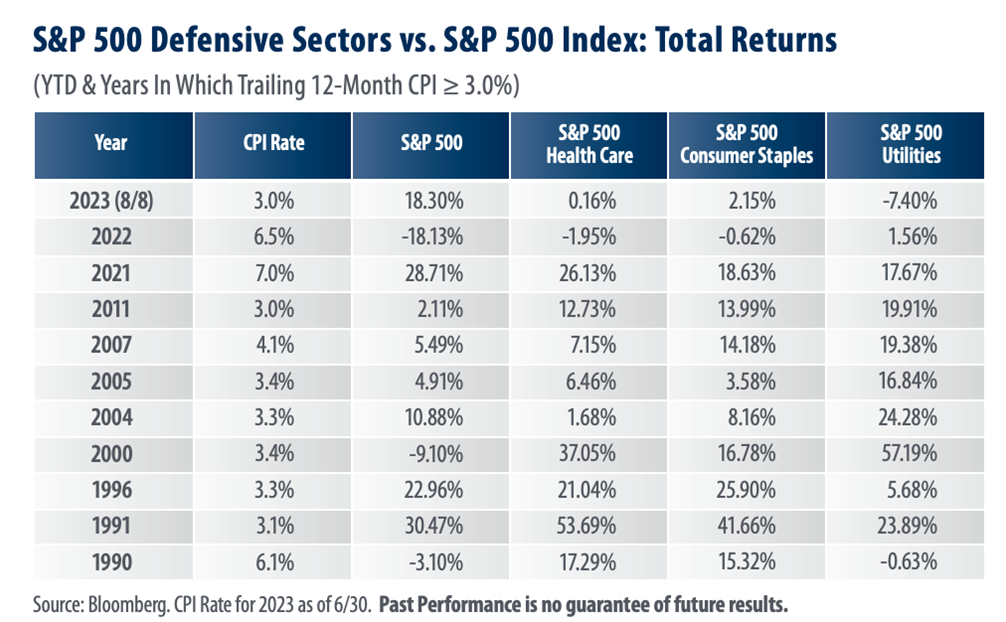
FirstTrust’s chief market strategist Robert Carey found that the defensive sectors of health care, consumer staples and utilities have historically outperformed the S&P 500 index when the consumer price index (CPI) was above its historical average of 3.0%. This is in addition to these sectors’ tendency to hold up better when the S&P 500 incurs bouts of downside volatility.
HAL 9000 Would Be Jealous
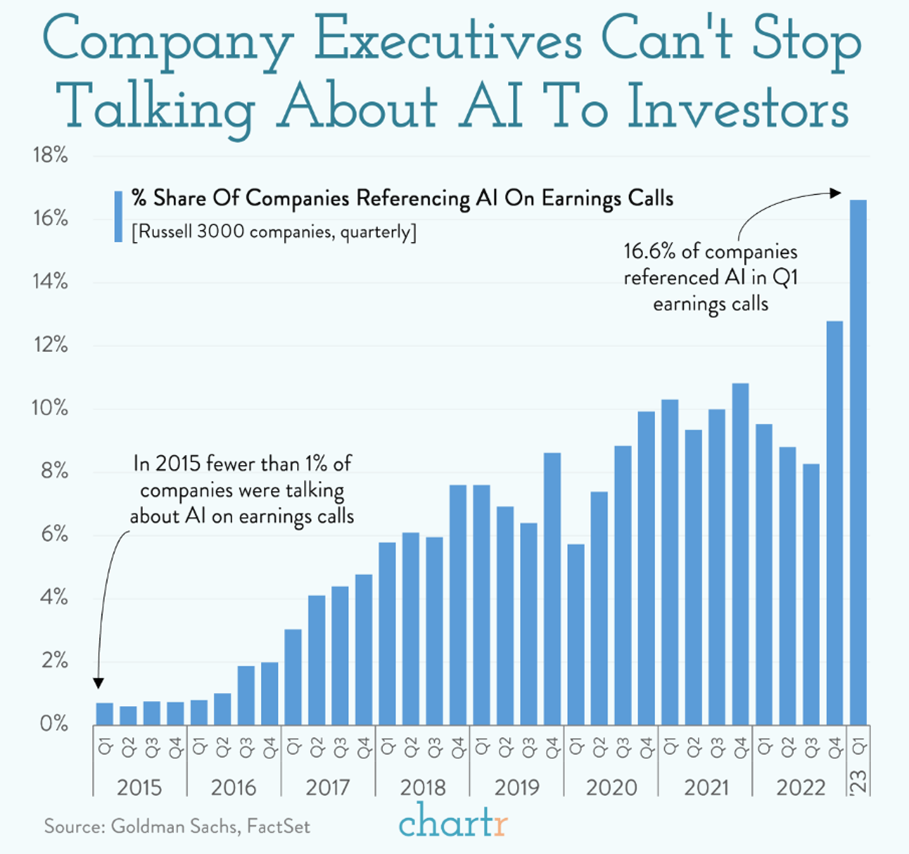
As a bit of a follow-up to last week’s Investor Update, I’ll end with artificial intelligence (AI). The number of companies discussing AI on their earnings conference calls is increasing, according to Goldman Sachs.

-
Online Exclusive: Defining Inflation for Your Portfolio
Any time in history when a nation has seen a dramatic increase in available cash, inflation has been a concern. How should investors respond when inflation heats up and poses risk to their portfolios? -
Should You Buy Bonds When Interest Rates Are Rising?
Whether interest rates are rising or falling, a custom ladder of high-quality bonds will produce a consistent cash flow. -
Design Your Portfolio With the Worst 2% of Times in Mind
A “suboptimal portfolio” that you can tolerate is better than an “optimal” one that you can’t stick with. -
Incorporating Investor Sentiment Into Your Portfolio Decisions
There is a long-running link between investor sentiment, like the AAII Sentiment Survey, reaching unusual levels and the market changing direction. -
Beyond Borders: Your Gateway to Global Market Investing With AAII
Visit a community focused on helping investors like you understand the intricacies of both emerging and established markets around the world.
Members are looking for your input. Can you help with this question from the Global Market Investing Community?
“Different countries have unique cultural attitudes toward business, as well as diverse regulatory landscapes that can significantly impact investment strategies. Have you ever bought shares in a foreign company? What did you learn from the experience?”
Tap the button and then choose the Join the Community button on the right to answer this question in the AAII Community
Answer This Question in the AAII Community »
AAII Sentiment Survey
Bullish sentiment decreased and is below average for the second consecutive week in the latest AAII Sentiment Survey. Bearish sentiment is above average for the first time in 12 weeks.
Bullish sentiment, expectations that stock prices will rise over the next six months, decreased 3.6 percentage points to 32.3%. Optimism is below its historical average of 37.5% for the second consecutive week.
Neutral sentiment, expectations that stock prices will stay essentially unchanged over the next six months, decreased 2.2 percentage points to 31.8%. Neutral sentiment is below its historical average of 31.5% for the ninth time in 12 weeks.
Bearish sentiment, expectations that stock prices will fall over the next six months, increased 5.8 percentage points to 35.9%. After 11 consecutive weeks of below-average readings, pessimism is above its historical average of 31.0%.
The bull-bear spread (bullish minus bearish sentiment) decreased 9.4 percentage points to –3.7%. This is the second consecutive week that the bull-bear spread is below its historical average of 6.5%.
This week’s special question asked AAII members how they would describe the current economy. Here are the responses:
- Strong: 33.1%
- Mixed with areas of strength and weakness: 43.4%
- Weak: 7.4%
- Not sure/no opinion: 15.3%
Bullish: 32.3%, down 3.6 points
Neutral: 31.8%, down 2.2 points
Bearish: 35.9%, up 5.8 points
Bullish: 37.5%
Neutral: 31.5%
Bearish: 31.0%
See more Sentiment Survey results.

August 17, 2023 Can You Use ChatGPT to Create a Portfolio of Stocks?
August 10, 2023 Earnings Are Better Than Expected, but Look Beyond the Surprises
August 3, 2023 How Much Is a Mega Millions Lottery Ticket Worth?
July 27, 2023 Should Barbie Follow Her Fund Manager to Another Firm?

Discussion
Barry from TX posted over 3 years ago:
The apocalypse must be near. These data points have syzygy. The shifts in the historical contrarian AAII Sentiment survey toward bearishness align with Charles's mashup of charts on the impact of the costs of rising interest rates and defensive portfolio allocation alternatives and the More on AAII references. If the Heavens part later today, it might be a sign to sell your NVDA.
You need to log in as a registered AAII user before commenting.
Create an account