

Current Valuation Ranges for Stocks
by Charles Rotblut | September 14, 2023
Catch me, along with two other seasoned AAII experts, at the MoneyShow in Orlando, Florida, on October 31, 2023. I present three segments: “Your Investing Education Is Our Mission,” focusing on AAII’s commitment to investor empowerment; “The Three Pillars for Successful Dividend Investing,” an exploration of our total-return strategy; and “Combining Value, Momentum and Quality,” a look at a compelling active investing approach. Click here for more information.
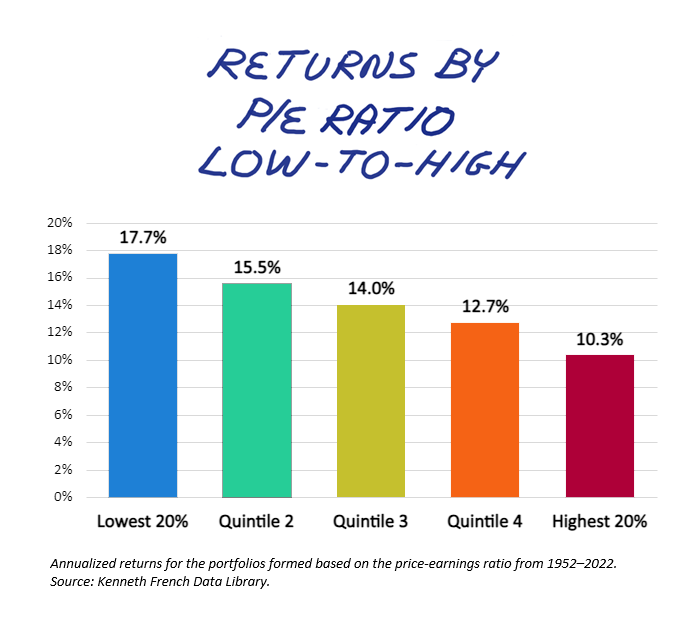
Academic studies on the value premium—the additional return for investing in portfolios of stocks with low valuations—use percentile rankings. Stocks are ranked based on whether they are cheap or expensive relative to all other stocks based on a given ratio such as the price-earnings (P/E) ratio or the price-to-book-value (P/B) ratio.
The Value Grades and Scores used in A+ Investor and VMQ Stocks are based on a similar ranking process. Stocks with comparatively lower valuations are assigned better grades and scores. Stocks with comparatively higher valuations are assigned worse grades and scores.
An advantage to using relative valuations is that they will always identify stocks. The downside is that they shift with market conditions. When the overall market gets more expensive, so will the absolute range of what counts as a cheap valuation.
With this in mind, here are the current ranges for the valuation ratios included in our Value Grade and Score. Value investors will want to stay below the median and preferably closer to or below the cheapest 20% (lowest quintile). The most expensive 20% (highest quintile) should be viewed as a valuation danger zone.
Price to Sales
The price-to-sales (P/S) ratio is determined by dividing market price per share by the sales per share for the most recent 12 months. Seeking undervalued stocks based upon the price-to-sales ratio was first popularized by Kenneth Fisher in his 1984 book “Super Stocks.”
Proponents of the price-to-sales ratio argue that earnings-based approaches to selecting stocks are inferior because earnings are influenced by many management assumptions trickling through the accounting books. The price-to-sales ratio can provide a meaningful valuation tool when negative earnings render earnings-based models useless.

Price to Earnings
The price-earnings (P/E) ratio, or earnings multiple, is one of the most popular measures of company value. It is computed by dividing the current stock price by earnings per share for the most recent four quarters.
The price-earnings ratio is followed by so many because it relates the market’s expectation of future company performance—embedded in the price component of the equation—to the company’s actual recent earnings performance. The greater the expectation, the higher the multiple of current earnings investors are willing to pay for the promise of future profits. However, there is no guarantee that these expectations will be met, making high price-earnings stocks riskier.

Enterprise Value to EBITDA
The ratio of enterprise value to earnings before interest, taxes, depreciation and amortization (EBITDA) is determined by dividing enterprise value for the most recent quarter by EBITDA for the most recent 12 months. Enterprise value is equal to the market value of equity (including preferred stock) plus interest-bearing debt minus excess cash.
Many investors feel that a company’s enterprise value relative to its EBITDA is a better way to measure company value than the price-earnings ratio alone. The ratio is neutral to the company’s capital structure and capital expenditures (capex).

Shareholder Yield
A stock’s shareholder yield—the sum of its buyback yield and dividend yield—shows the percentage of total cash that the company is paying out to its shareholders, either in the form of a cash dividend or as expended cash to repurchase its shares in the open market. Thus, if a company is paying a 5% dividend yield and has a buyback yield of 10%, its shareholder yield would be 15%.
Unlike other valuation measures, shareholder yield is inversely related to value, with higher shareholder yields implying lower valuations. A negative shareholder yield occurs when the percentage increase in the number of shares outstanding is greater than the stock’s dividend yield.

Price to Book Value
The price-to-book-value ratio is calculated by dividing the share price by book value per share. Book value is generally determined by subtracting total liabilities from total assets and then dividing by the number of shares outstanding. It represents the value of the shareholder’s equity based upon historical accounting decisions.
The price-to-book ratio was a favorite measure of Benjamin Graham and his disciples who sought companies with a share price below the book value per share.

Price to Free Cash Flow
The price-to-free-cash-flow (P/FCF) ratio is calculated by dividing the share price by free cash flow per share for the most recent 12 months. Cash flow is reported on the cash flow statement. It is the sum of cash from operations, cash from investing and cash from financing adjusted for exchange rate effects. Free cash flow is calculated by subtracting capex and dividend payments from cash flow from operations.
The cash flow statement is harder to manipulate through accounting techniques than earnings. Unlike earnings, which are an accounting figure, cash flow represents the net total of cash flowing into and out of the company over a given period.


-
Understanding AAII’s Revised Value Grade
AAII’s Value Grade for stocks now incorporates six fundamental variables into a single value grade, allowing members to judge which stocks are potential bargains and which are expensive. -
Selecting a Valuation Method to Determine a Stock’s Worth
Guidance on when it makes sense to compare a stock’s price to fundamental factors or other companies and when a stock’s absolute value should be calculated instead. -
Technology Titans: Top Semiconductor ETFs and Their Stocks
Comprising companies vital to modern technology, the semiconductors & semiconductor equipment industry has outperformed in 2023 year to date. -
The Importance of Considering Marginal Taxes When Taking Withdrawals
Your withdrawal strategy should be optimized to take into account potential spikes in marginal tax rates caused by factors like taxation of Social Security benefits and income-based Medicare premiums. -
I Took Out a Loan
In her latest My Investing Discoveries blog post, Anine Sus takes out a loan for the first time but not without a solid plan.
Members are looking for your input. Can you help with this question from the Retirement Withdrawals Community?
“A recent AAII Journal article emphasized the importance of considering marginal tax rates when planning retirement withdrawals, particularly in relation to the taxation of Social Security benefits and income-based Medicare premiums. What types of tax strategies are you using in retirement?”
Tap the button and then choose the Join the Community button on the right to answer this question in the AAII Community
Answer This Question in the AAII Community »
AAII Sentiment Survey
Bullish sentiment is below average for the fourth time in five weeks in the latest AAII Sentiment Survey. Neutral sentiment is at its highest level since May, and bearish sentiment is below average for the second consecutive week.
Bullish sentiment, expectations that stock prices will rise over the next six months, decreased 7.8 percentage points to 34.4%. Optimism is below its historical average of 37.5% for the fourth time in five weeks.
Neutral sentiment, expectations that stock prices will stay essentially unchanged over the next six months, increased 8.1 percentage points to 36.4%. Neutral sentiment was last higher on May 18, 2023 (37.4%). Neutral sentiment is above its historical average of 31.5% for the fourth time in five weeks.
Bearish sentiment, expectations that stock prices will fall over the next six months, decreased 0.4 percentage points to 29.2%. Bearish sentiment is below its historical average of 31.0% for the second consecutive week.
The bull-bear spread (bullish minus bearish sentiment) decreased 7.4 percentage points to 5.2%. This is the fourth time in five weeks that the bull-bear spread is below its historical average of 6.5%.
This week’s special question asked AAII members about their perception of inflation. Here are the responses:
- Slowing, but not by enough: 49.4%
- It’s returning to a more acceptable pace: 31.9%
- It’s still rising too quickly: 16.7%
- Other/not sure: 1.7%
Bullish: 34.4%, down 7.8 points
Neutral: 36.4%, up 8.1 points
Bearish: 29.2%, down 0.4 points
Bullish: 37.5%
Neutral: 31.5%
Bearish: 31.0%
See more Sentiment Survey results.

September 7, 2023 Guidelines for Selling Stocks
August 31, 2023 Interest Rates Are Higher. Your Taxes Could Be Too.
August 24, 2023 August Charts of Interest: More Costly to Finance Big Purchases
August 17, 2023 Can You Use ChatGPT to Create a Portfolio of Stocks?

Discussion
Barry from TX posted over 3 years ago:
Charles, once again you try to save us from our own biases. (A past boss cautioned me to “Never try to teach a pig to sing.”) This article recapitulates the 6 most popular alternative ways to calculate “valuation” ratios to ESTIMATE the size of the elusive market anomaly called “value premium.” Please remember these ratios are only ephemeral estimates based on accounting system classifications based on management philosophy. Seeking 6 differing perspectives sounds a lot like the parable of “The Six Blind Men” who had encountered an elephant and wanted to “see” the characteristics of the beast. Each blind man feels only one part of the elephant's body and comes away with different conclusions about what an elephant is. The moral is that people have a tendency to discover “truth” based on their limited, subjective experience and ignore other people's experiences which could be equally true. Nobelists Eugene Fama and Kenneth French first identified the value premium in 1992 using a measure they called HML (High book-to-Market ratio minus Low book-to-market ratio) to measure equity returns based on valuation. That is essentially the procedure AAII uses. Other experts, such as John Bogle of Vanguard fame, argue that no value premium exists, claiming that value premiums are period-dependent. Thus, even the most famous investing gurus exhibit similarities to blind men seeking truth in a blind world. Since there is no hope in trying to teach us to sing, thanks Charles, for at least trying to gently nudge us to consider seeking PRESENT LOW value premiums during a period when many equally blind investors are seeking to capture PAST value by investing in stocks with VERY HIGH valuations that may require more than 50 years to get a return on investment equal to the current premium.
Barry from TX posted over 3 years ago:
Last week's AAII sentiment survey results indicate that BOTH bulls and bears are losing their convictions ... and are stampeding to a Neutral (aka indecisive) outlook. This reminds me of the denouement in the movie Titanic where everyone ran to the Grand Ballroom to avoid falling overboard only to find the whole boat was sinking, not just the sides.
John L from NJ posted over 3 years ago:
It is really hard to beat the market using valuation ratios that everyone knows. The only way to beat the market is to know something no one else knows. If valuation metrics and other public information (academic studies) is all you know; check out an index fund. It knows as much as you.
Donald from IL posted over 3 years ago:
Cash is King and the vehicle is a Trojan Horse . Where do you want to be when cash has more Risk and the Markets are predicting the Future 6 to 9 Months out . In summary , planning for an Investor is a two edged sword ; short-term or longterm Investor ; safe & stable : in case of stable a pony or dog show .
You need to log in as a registered AAII user before commenting.
Create an account