

Magnitude Versus Frequency of Outperformance, Plus the Fed’s Rate Cut
by Charles Rotblut | August 01, 2019
“It’s not how often you beat the market but how much you beat it by when you outperform versus how much you lose by when you underperform.” Robert Hagstrom, the chief investment officer of EquityCompass and author of several books on Warren Buffett, shared this insight while speaking at the CFA Institute’s Seminar for Global Investors (SGI) last week.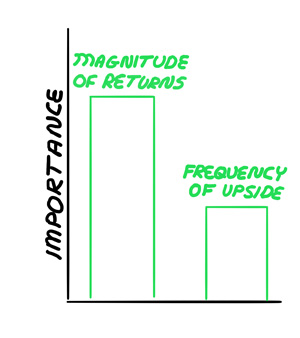
He made the comment while discussing the concepts of frequency and magnitude. Frequency is how often an investor or a strategy beats the market, or their benchmark. It can also refer to positive returns. Magnitude is how much they beat the market by or how big their gains are. Magnitude and frequency are very different things.
Too often, investors—both individual and institutional—focus on frequency. Shorter-term underperformance is often grounds for abandoning a strategy or firing a manager. Making a change based on disappointing short-term returns may feel good at the moment but doing so can result in missing out on a large magnitude of outperformance over the long term.
Strategies with great long-term returns and skilled investors/portfolio managers will experience periods where they lag the market and/or their benchmark. They will also, at times, lose money. Realizing a large magnitude of long-term outperformance and gains requires sticking with such strategies and managers when it’s uncomfortable to do so.
Consider index investing, a simple strategy anyone could have followed. In the aftermath of the financial crisis, index investing was bemoaned and criticized. Many pundits appearing in the financial media were outright criticizing it. Yet, from the start of the current bull market in March 2009 through the end of this past June, the SPDR S&P 500 ETF (SPY) has returned 391% versus 374% for the average large-blend exchange-traded fund (ETF). There are many large-cap blend funds that have performed even worse. Those who listened to the pundits or focused on the short-term frequency of bad returns stemming from the financial crisis 10 years ago could have easily missed out on the large magnitude of gains that have since occurred.
Michael Falk, a partner of Focus Consulting Group and a speaker at one of the SGI’s panels, nudged me to add sequence to the discussion of frequency and magnitude. Sequence of returns is the order in which returns occur. A period of bad returns can do damage to a portfolio when the timing of losses concurs either with withdrawals starting or when the amount withdrawn is significant relative to the portfolio’s size. Sequence of returns is particularly important for those entering retirement or just recently retiring since an ill-timed bear market can have a lasting impact if equity investments are sold to fund withdrawals. (Sequence of return risk can be offset by having realized a large enough magnitude in the growth of your assets from the combination of good investing decisions and disciplined saving.)
The three fit together and match what we believe in at AAII. Realizing a significantly large magnitude of long-term gains will help you achieve your long-term goals, such as retiring comfortably. Focusing too much on frequency will cause you to trade and strategy-jump too often, increasing the risk of not achieving your goals. Ensuring that your shorter-term cash flow needs are covered (e.g., through shorter-term savings, allocating up to five years’ worth of withdrawals to so-called riskless assets as retirement approaches, having sources of guaranteed income, etc.) will help you to financially withstand an ill-timed sequence of bad returns.
Yesterday’s Federal Reserve Rate Cut
As you well know by now, the Federal Open Market Committee (FOMC) lowered interest rates by 25 basis points (0.25%) yesterday. It was the first rate cut since December 2008. At nearly 3,900 days, it was the longest streak without a rate cut since a 4,115-day stretch that ended in 1954, according to Bespoke Investment Group. The FOMC also chose to end the runoff of its portfolio two months earlier than planned.
What happens next remains to be seen. The CME’s FedWatch Tool is calling for at least one more rate cut before the end of the year. At last week’s CFA seminar, Danielle DiMartino Booth, CEO of Quill Intelligence, described the service sector as experiencing deflation on an ex-housing and rent basis. Yesterday, Fed chairman Jerome Powell referenced deflationary pressures in foreign markets as part of the reason for this week’s rate cut. To the extent that global growth remains weak and deflationary pressures do not abate, further rate cuts are a possibility.

-
Why a New Allocation Approach Is Needed – AAII founder James Cloonan explains why investors should focus on long-term gains instead of shorter-term volatility and offers a strategy for coping with an ill-timed sequence of returns.
-
The Sequence in Which Returns Occur Affects Your Wealth – In this 2015 AAII Journal article, I demonstrated how the order in which good and bad returns occur can significantly impact your portfolio and your wealth.
Optimism about the short-term direction of the stock market rose as pessimism fell. Both bullish and bearish sentiment are at their respective highest and lowest levels in nearly three months. The latest AAII Sentiment Survey also shows a small increase in the number of individual investors describing their outlook as neutral.
Bullish sentiment, expectations that stock prices will rise over the next six months, jumped 6.7 percentage points to 38.4%. Optimism was last higher on May 8, 2019 (43.1%). The historical average is 38.5%.
Neutral sentiment, expectations that stock prices will stay essentially unchanged over the next six months, rose 1.3 percentage points to 37.5%. The increase keeps neutral sentiment above its historical average of 31.0% for the 26th time in 27 weeks.
Bearish sentiment, expectations that stock prices will fall over the next six months, plunged 8.0 percentage points to 24.1%. Pessimism was last lower on May 8, 2019 (23.2%). Bearish sentiment is below its historical average of 30.5% for just the third time in 12 weeks.
This is just the eighth time this year that bullish sentiment has been above 38.0%. At current levels, all three indicators are within their typical ranges.
The survey period runs from Thursday through Wednesday. Most of this week’s responses were recorded before yesterday’s rate cut announcement by the Federal Open Market Committee (FOMC).
Many individual investors have been monitoring trade negotiations, particularly between the U.S. and China. The ability of large-cap stocks to stay near record highs may be encouraging some investors, though others still anticipate a drop occurring. Also having an influence are Washington politics (including President Trump), geopolitics, valuations and corporate earnings. Perceptions of the pace of economic growth, along with monetary policy and interest rates are also playing in a role.
This week’s special question asked AAII members what impact geopolitical/international events are having on their outlook for stocks. Slightly more than two out of five respondents (43%) say international events are having a negative impact or otherwise are causing them to be more cautious. An additional 8% say they are planning on reducing their exposure to foreign markets. Approximately 26% say international events are not influencing their outlook for stocks. Nearly 10% of respondents describe themselves as optimistic, with some expecting a trade deal to be reached or for the U.S. stock market to not be affected by international issues.
Here is a sampling of the responses:
- “Not much. There is always something going on.”
- “Trade battles and higher tariffs lead me to believe that the economy, earnings and the value of stocks will fall.”
- “I have been weary of the global economy, but the recent European Central Bank (ECB) activity is encouraging.”
- “It’s apparent to me that tariff contests are going on too long and should soon cause a slowdown in international trade.”
- “The outlook for Europe and developing nations is cloudy. Cutting exposure.”

Bullish: 38.4%, up 6.7 points
Neutral: 37.5%, up 1.3 points
Bearish: 24.1%, down 8.0 points
Bullish: 38.5%
Neutral: 31.0%
Bearish: 30.5%
July 25, 2019 Spotting Dividend Warning Signs
July 18, 2019 How the VMQ Stocks Momentum Indicator Was Changed
July 11, 2019 The Financial Markets’ Mixed Signals
June 27, 2019 A Five-Part Framework for Analyzing a Hot IPO Stock

Discussion
No comments have been added yet. Add your thoughts to the discussion!
You need to log in as a registered AAII user before commenting.
Create an account