A+ Investor is AAII’s online investment discovery, analysis and tracking suite. Whether you invest in mutual funds, ETFs or individual stocks, resources are available to help you make informed investing decisions that benefit your portfolio.
In this month’s Making the Grade, we highlight tools to help you identify and evaluate possible stock investing opportunities.
The Stocks area of AAII.com has a collection of tools and resources for those looking to find and evaluate stock investing opportunities.
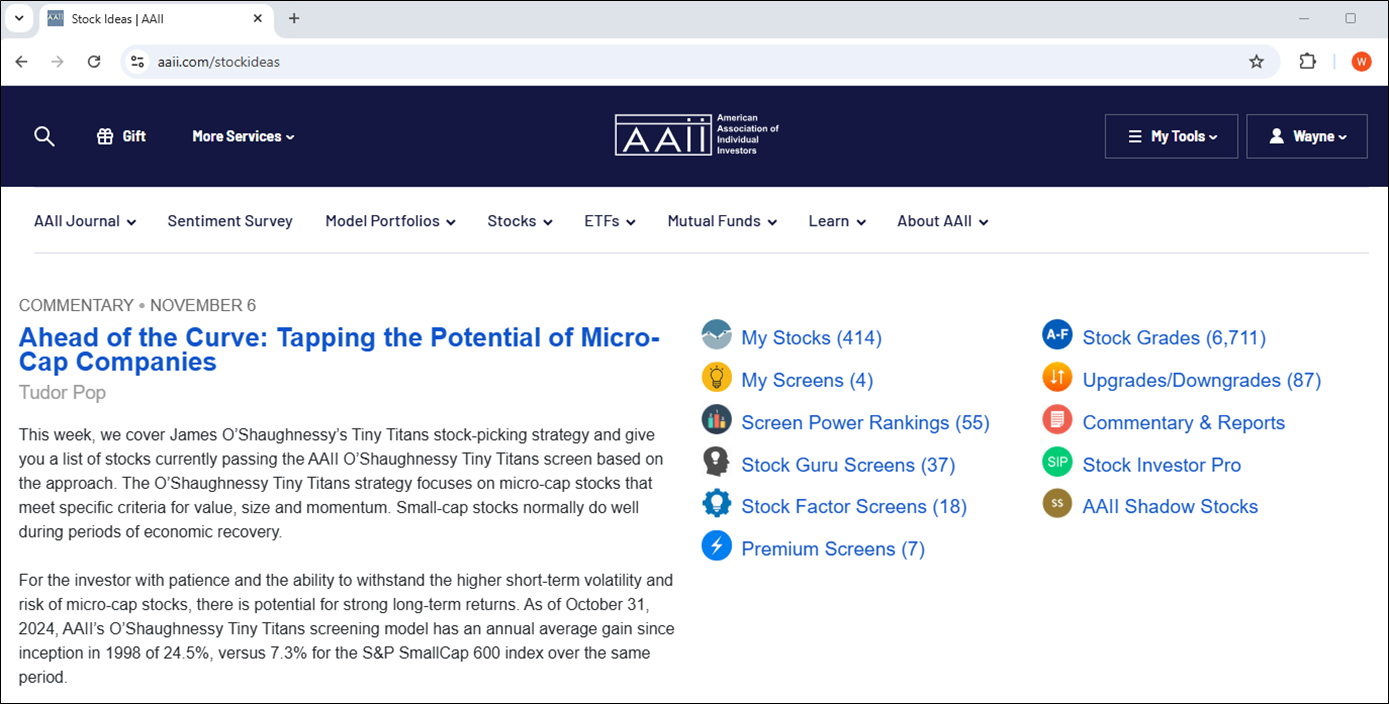
For finding potential stocks, the Stocks area includes:
AAII’s stock screens run the entire spectrum, from value-based to focusing primarily on growth. Some AAII Stock Screens are geared toward large-company stocks, while others uncover micro-sized firms. Most fall somewhere in the middle. A number of specialty screens even attempt to gauge the stock selection impact of a single variable—such as earnings estimates revisions. The characteristics of these stock investing approaches vary widely.
Choosing a Screen
Understanding the investment characteristics of any approach you are using is essential. By browsing through the passing companies tab of a stock screen, you can better understand the kind of companies a strategy favors and get a sense for any industry concentrations that may be generated. The purpose of AAII’s stock screens is to give you access to a wide range of investing approaches.
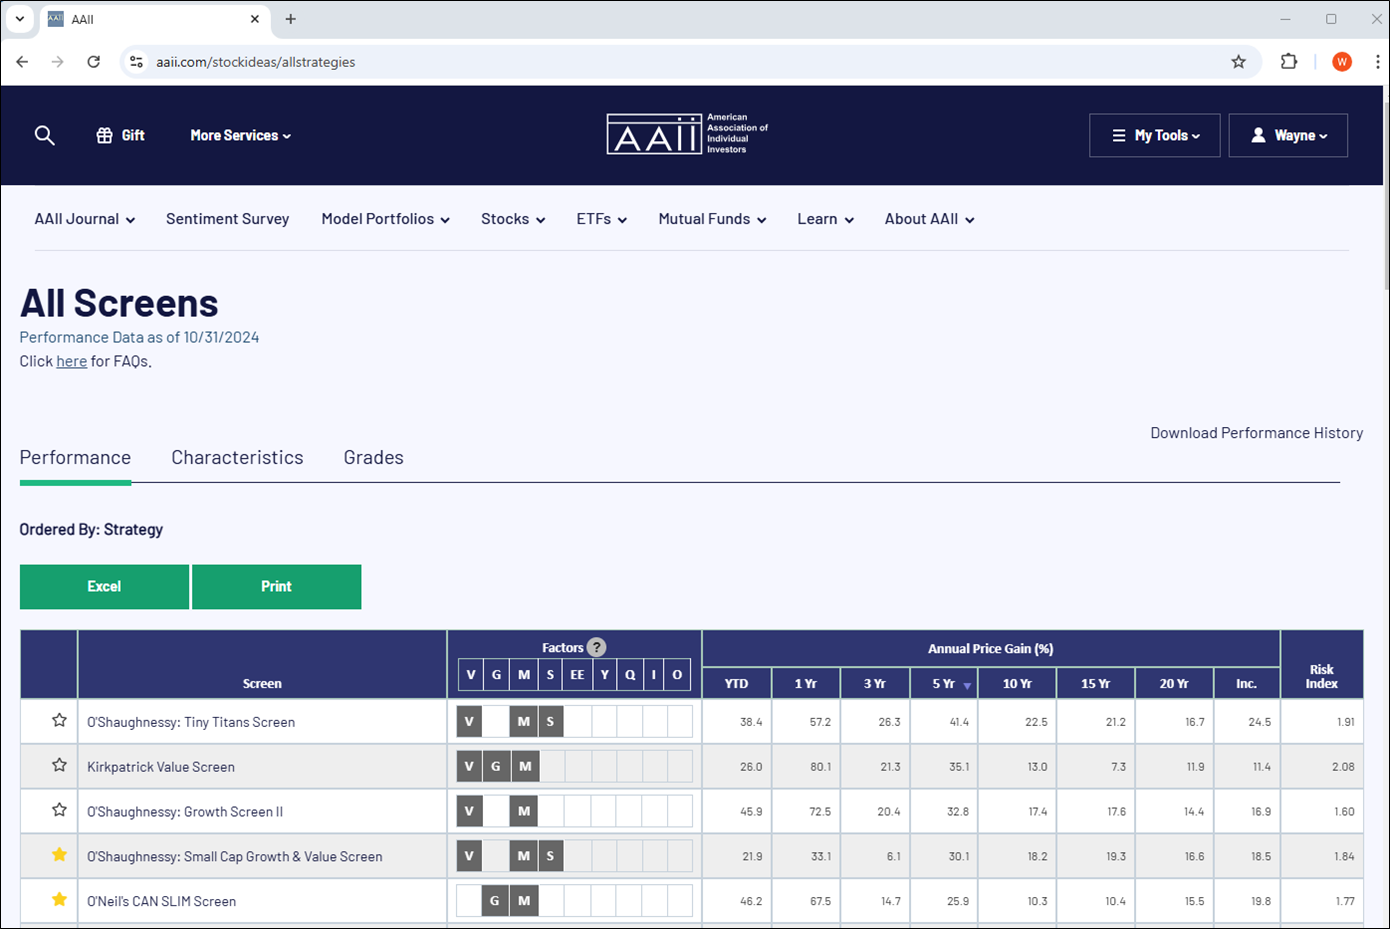
The All Screens page lists all of the screening strategies AAII tracks. Here, you can see the factors underlying each strategy—value, growth, momentum, size, earnings estimates, yield, quality and industry/sector.
The All Screens table also includes annualized performance data based on simulated trading of each screen. The Risk Index column shows how volatile the monthly returns of each screen are compared to the S&P 500 index.
Remember that the screens here are AAII’s interpretations of the investing approaches various strategists advocate. While we have attempted to illustrate a practical set of rules for each approach, the screens are only the first step. We recommend using them to generate an initial list of potential investments that merit further research. In addition, our method to track the screens does not replicate a longer-term buy-and-hold strategy, which tends to be the optimal approach for an individual investor.
Most importantly, remember that screening is just a first step. There are qualitative elements that cannot be captured effectively by the very quantitative screening process that we present. Detailed fundamental analysis of any stock you are considering for purchase is necessary for successful investing.
The custom stock screener, an exclusive benefit to A+ Investor subscribers, allows you to build stock screens based on data elements that measure growth, valuation, financial strength, stock performance and more. With it, you can easily and quickly identify stocks that meet the fundamental criteria that matter most when selecting stocks.
This tool complements the popular Stock Screens and the A+ Stock Grades Screener, which lets you identify stocks based on their ranking on the investment factors of value, momentum, quality, growth and earnings estimate revisions.
You will find the link to the Custom Stock Screener on the A+ Investor dashboard page. You can also bookmark this page: www.aaii.com/stockideas/customscreener.
An intro video walks users through creating a stock screen.
Building a Stock Screen
With the custom stock screener, you build screens in two steps.
Selecting Your Filters
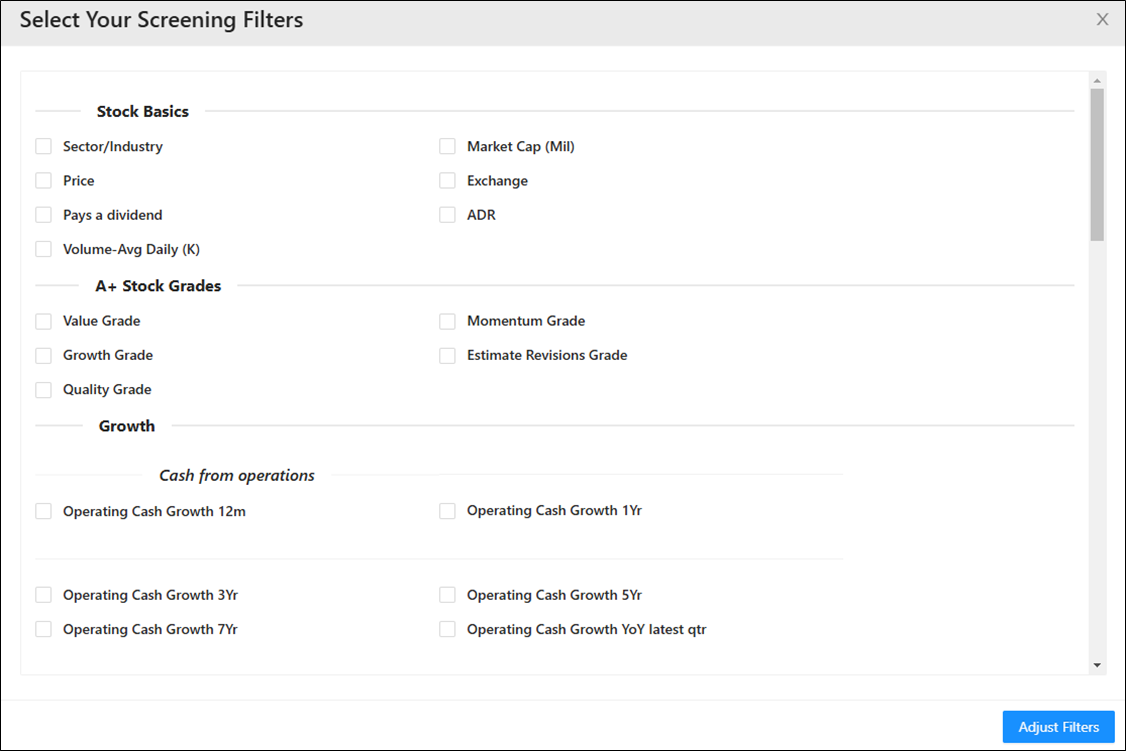
First, you select the filters you wish to use with your screen. There are currently over 70 fields to choose from. The fields are broken into a number of categories:
Adjusting the Filters
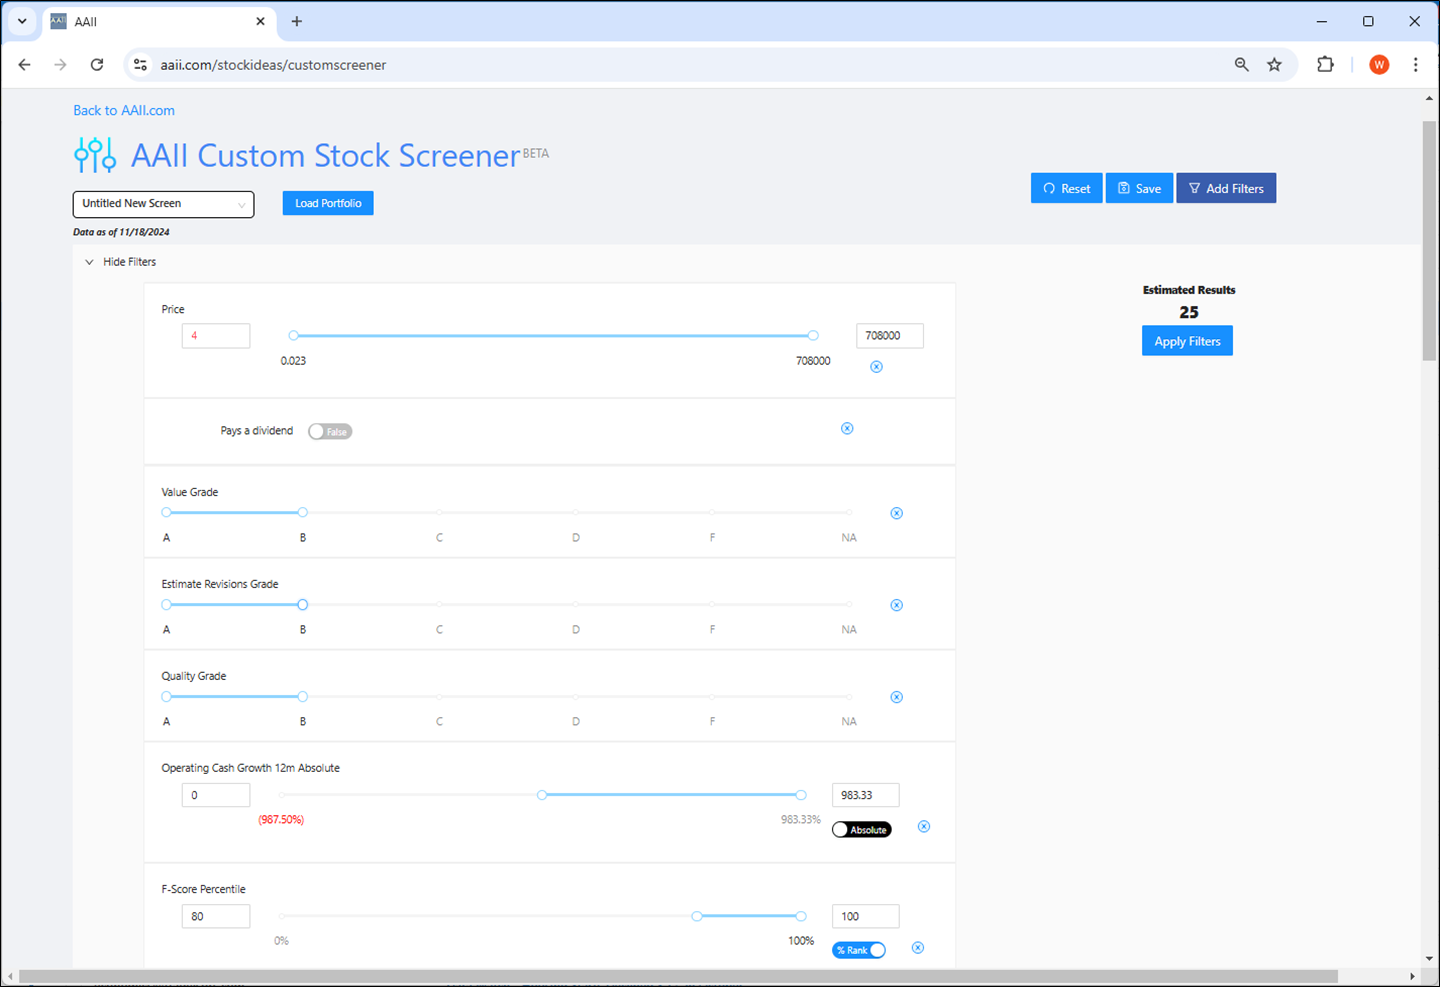
After selecting the filters for your screening, the second and final step is to adjust the parameters for the fields you chose. In effect, you specify the characteristics you are looking for in the stocks that pass your screen.
For numeric fields, you can filter based on the field’s absolute value or percentile rank. You can toggle between filtering based on “Absolute” or “% Rank” by clicking the blue button for the specific field.
By default, % Rank is the initial filtering option. But let’s say you want to screen for companies with a positive average annual dividend growth rate over the past three years. After selecting “Dividends Per Share Growth 3yr” from the filters list, you click the toggle button to screen for Absolute and then drag the slider dot from the left until the minimum range is 0 (zero).
Percentile ranks show how a company stacks up against all the companies in the AAII stock universe. Percentile ranks are helpful because they adapt as market and economic conditions change. For example, a price-earnings (P/E) ratio of 10.0 may be high or low depending on where we are in the market and economic cycle. But if you are looking for low price-earnings stocks, you can use the percentile rank to focus on the companies in the bottom 25% of the stock universe. While the absolute value that denotes the cutoff will change over time, you are always looking for the bottom 25% of stocks.
Applying Filters and Viewing Screening Results
Once you have finalized your screening parameters, the final step is to run it to view the passing companies. You can do this by clicking the “Apply Filters” button below the Estimated Results total.
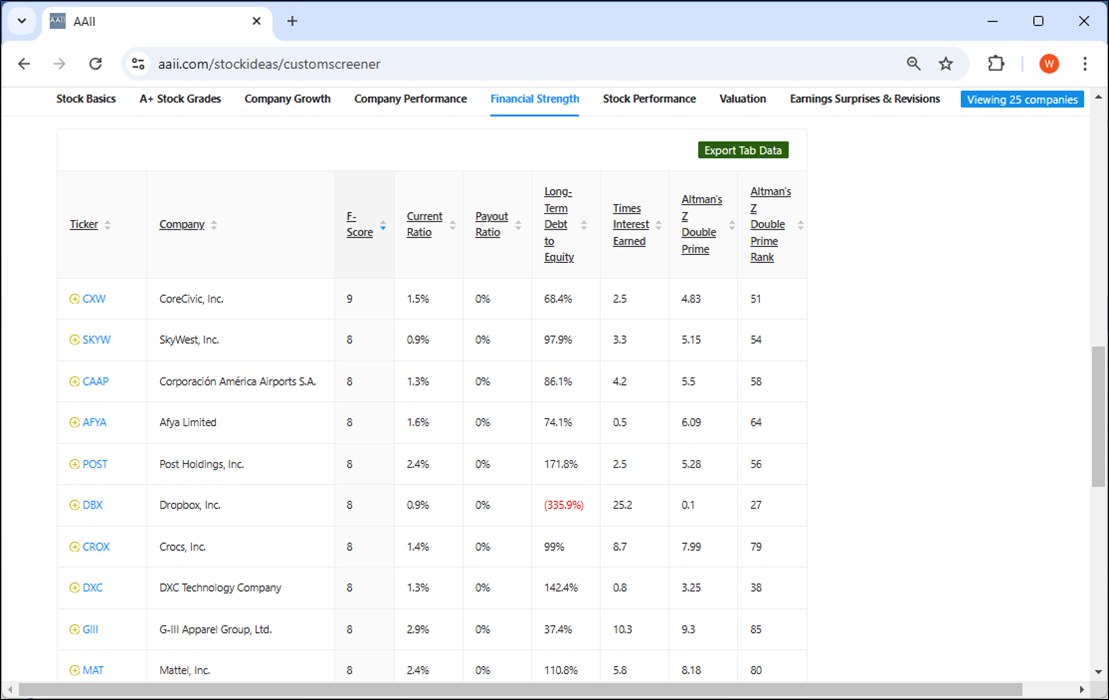
When you apply your screen, the passing companies are displayed in the data table at the bottom of the page. Here you can view a variety of data for the passing companies, grouped by similar data types. You can navigate between the different data tabs by clicking the data categories (Stock Basics, A+ Stock Grades, Company Growth, etc.).
Furthermore, you can sort a given tab by an individual data field by clicking on the data header.
Saving Your Screen
Once you have created a screen, you can save it for future use. To save a screen, click the “Save” button at the top-right of the screener page.
You can name the screen as well as provide a description.
You can then load saved screens from the drop-down menu on the top-left of the screener page.
For a more in-depth discussion of the A+ Custom Stock Screener, click here.
The A+ Stock Grades system is a grading tool based on percentile rankings of multiple key metrics within five investment factors: value, growth, momentum, earnings estimate revisions and quality. They represent a summary of a company’s fundamentals and give you a quick overview of how stocks rate based on the five investment factors that have been shown to produce market-beating results.
While you can review the A+ Stock Grades for specific companies, with the A+ Stock Grades Screener—an exclusive benefit of your A+ Investor subscription—you can also identify stocks with particular letter grades across the A+ rankings on value, growth, momentum, earnings estimate revisions and quality factors. To access the A+ Investor Grades Screener for stocks, go to www.aaii.com/stockideas/quant.
At the top of the A+ Stock Grades Screener page, histograms (bar graphs) show the stock universe’s distribution across the letter grades for each of the five A+ factors.
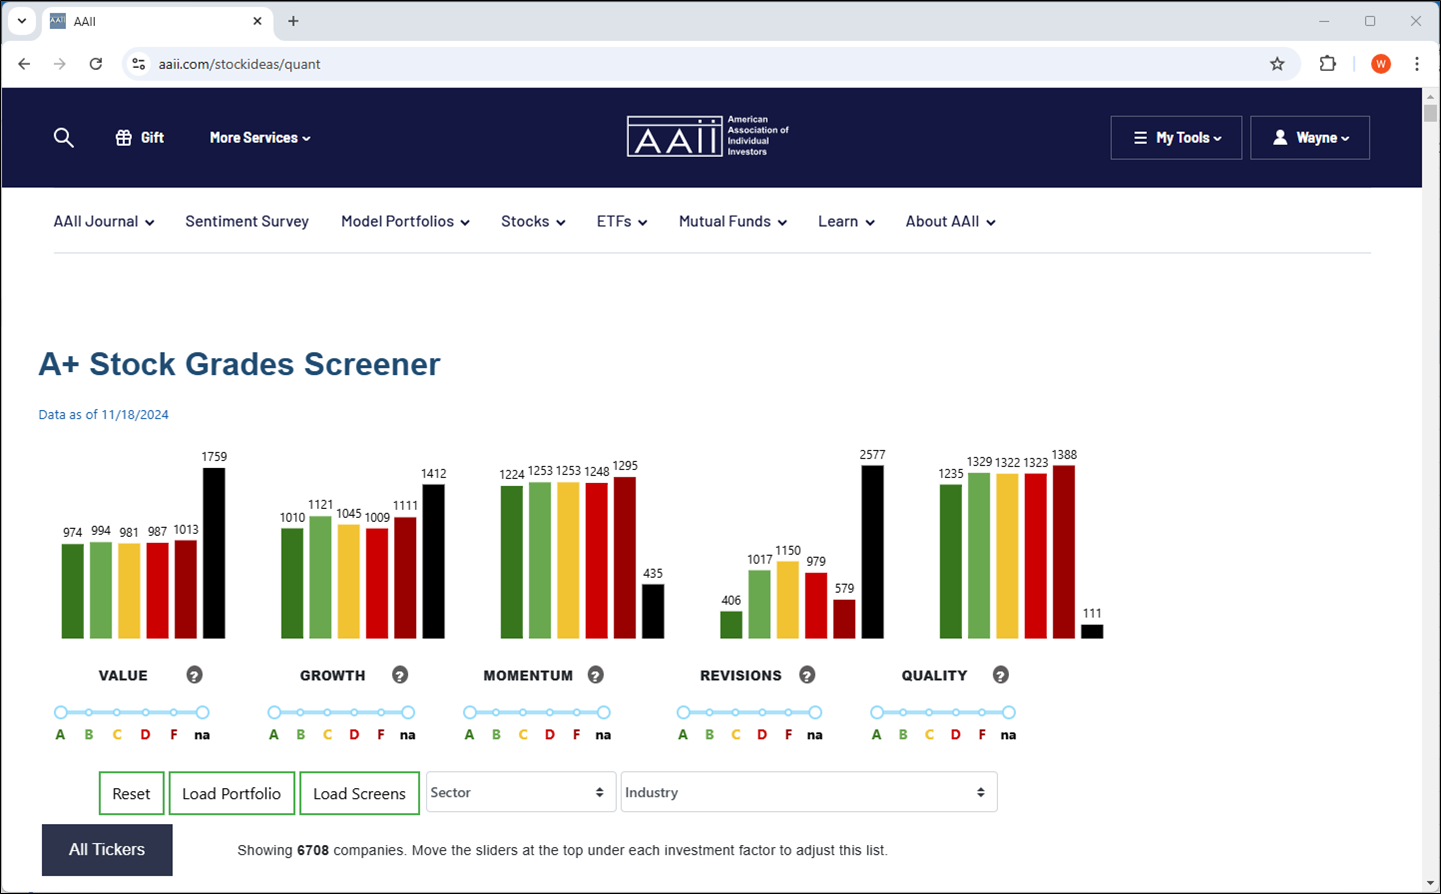
Furthermore, when you first visit the Stock Grades Screener page, there is a table listing all of the companies in the A+ Investor stock universe (roughly 6,700 companies).
You can sort this table based on the company name and the grade or raw score for each of the five factor grades. You can toggle between ascending and descending order for any column by clicking on the up/down arrow icon in the column heading.
Adjusting the Stock Grade Parameters
Let’s say, for example, you wanted to isolate only those stocks with Momentum and Quality Grades of A, a Value Grade of B or better, and Earnings Estimate Revisions and Growth Grades of C or better. You slide the white dots below the bar graphs for the respective grades to the desired ranges.
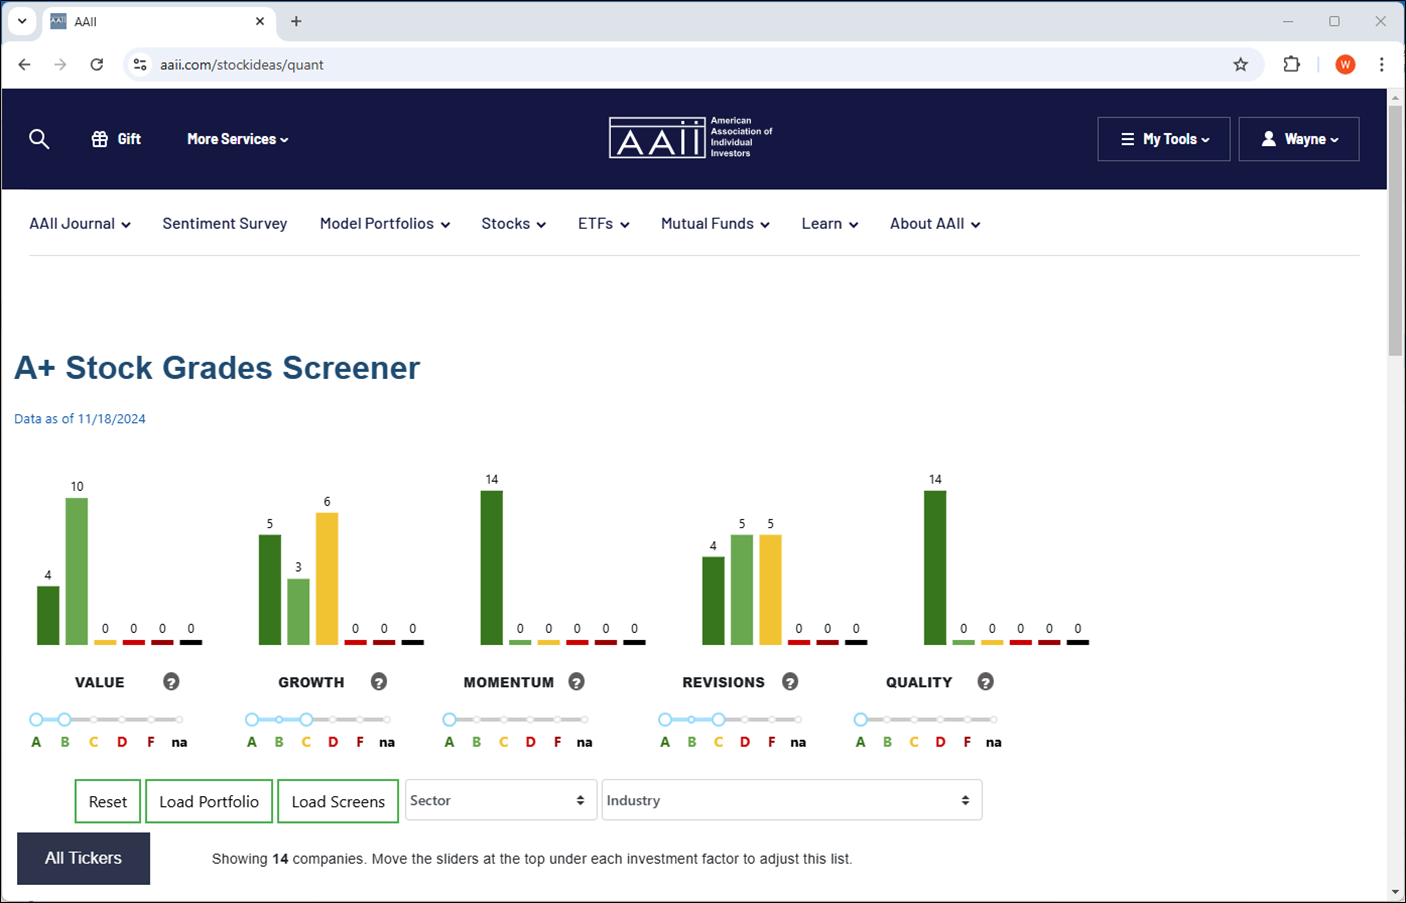
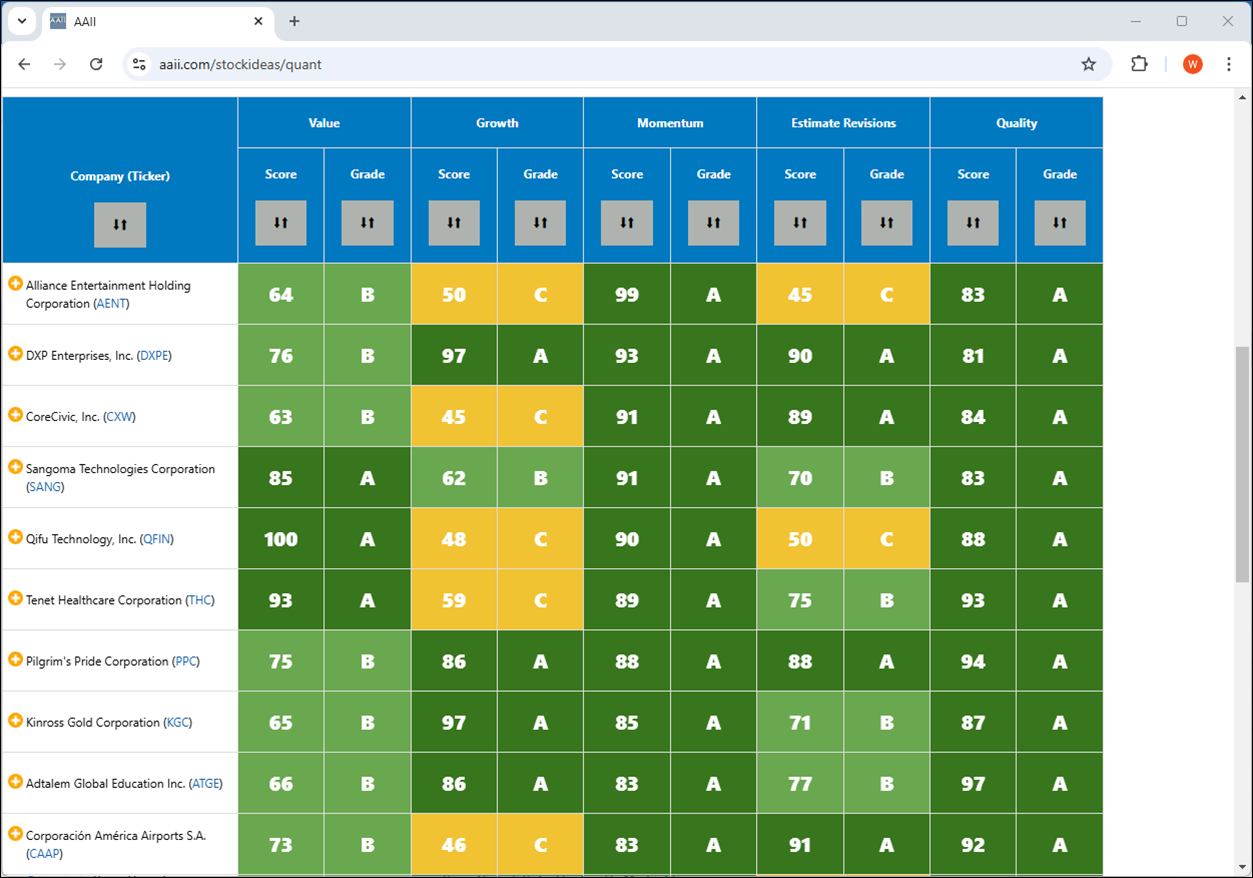
With data as of November 18, 2024, 14 companies met these parameters. Here is a subset of those companies, ranked in descending order by Momentum Score:
You can also apply grade filters to specific sectors and industries, stock idea passing companies, and personal portfolios from My Portfolio.
For more information on the A+ Stock Grades Screener, click here.
If you want to take a closer look at an individual stock, A+ Investor provides subscribers with a Stock Evaluator. This is a detailed report of an individual company, including its A+ Stock Grades, price chart, and detailed financial data for valuation, growth, ratios, earnings estimates, analyst ratings, financial statement data and insider transactions.
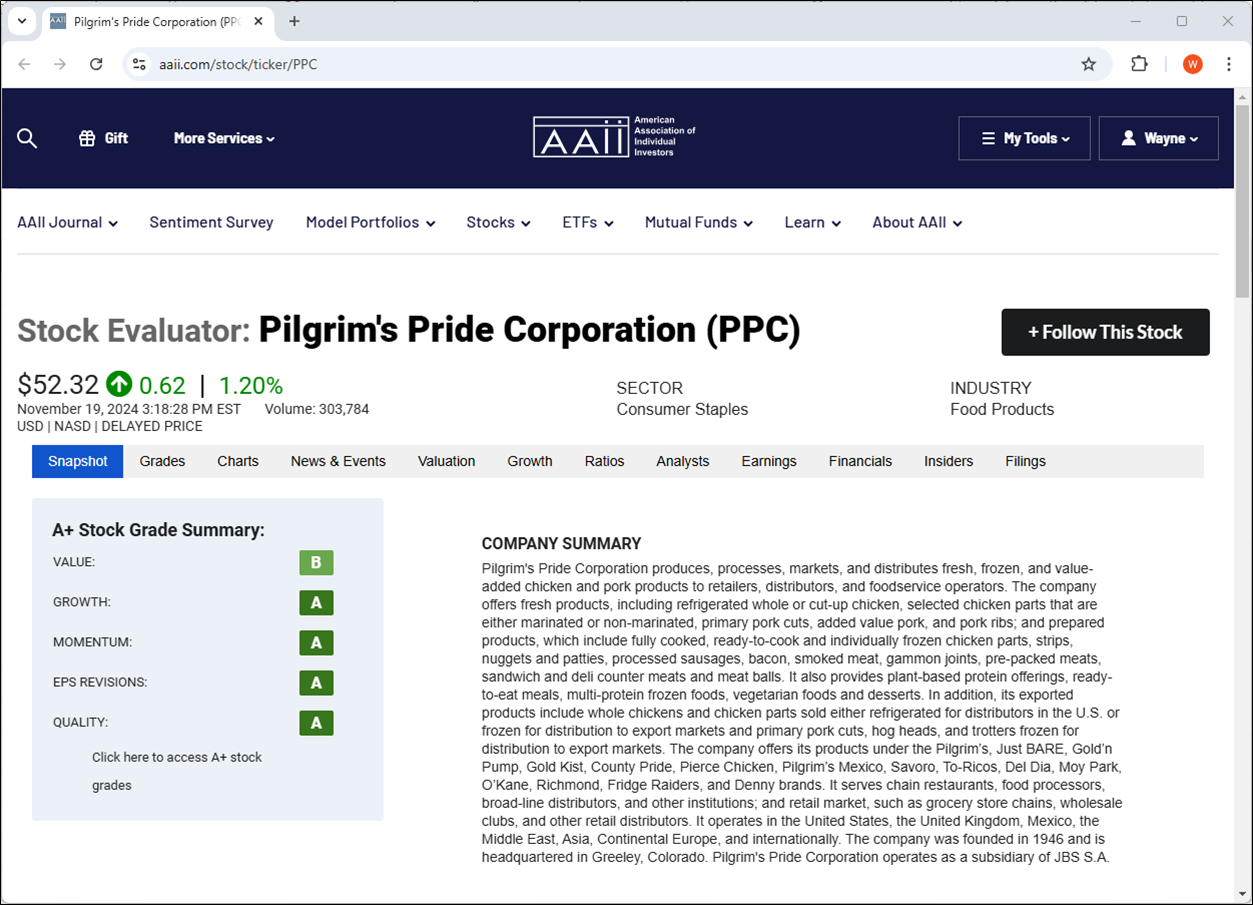
You can access a company’s Stock Evaluator by using the search function at the top-left of any AAII.com page. All price-related data is updated after the close of each trading day, while financial statement-related data is updated once a company files a new annual or quarterly report.
The Grades tab of the Stock Evaluator offers a detailed breakdown of the underlying data points used for calculating each grade.
The Analysts tab provides analyst ratings and recommendations, while the Earnings tab presents target prices and history. The tab also offers consensus earnings estimates and earnings surprise history for the last 25 quarters.
A+ Investor offers a comprehensive suite of tools and resources that empower you to make informed and confident investing decisions. From customizable stock screeners to detailed stock evaluators, the platform equips investors with everything they need to identify opportunities, evaluate strategies and build a portfolio aligned with their financial goals.
However, the information we’ve outlined here only scratches the surface of the screening and information A+ Investor offers stock investors.
Don’t stop at discovery—take the next step in optimizing your investing strategy. Visit the Stocks area of AAII.com today and explore the full range of tools and resources available through your A+ Investor subscription. Start making data-driven decisions and turn your investing aspirations into reality.
Get started now and unlock the potential of smarter investing!

