

A Quick Way to Analyze a Stock
by Charles Rotblut | April 29, 2021
Given that we are currently in the heart of first-quarter earnings season, I thought it would be timely to publish an updated version of suggestions for quickly analyzing a stock.
Much of what I wrote in the original version, published in 2017, remains valid today. This is because the rules don’t change much. A stock with an attractive valuation, strong financials and rising earnings expectations among analysts generally has favorable odds of rising in price.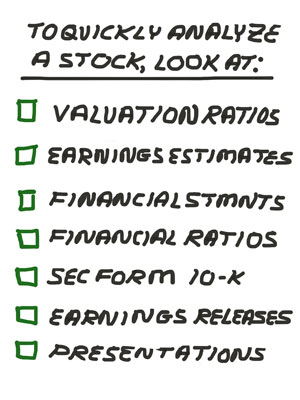
A helpful metric that was introduced between the original version and now is our A+ Stock Grading system. These grades quickly tell you whether a stock has a low valuation, good growth rates, strong momentum, positive earnings estimate revisions and good quality. If you have set up a portfolio in My Portfolio at AAII.com, you can go to the Investing Ideas page and scroll down to the A+ Stock Grades section. You’ll see a tab labeled “My Stocks.” It will show grades for all the stocks you saved in My Portfolio that we can calculate grades for. The grades are just like ones you received in school: A’s and B’s are good; D’s and F’s will get you grounded.
For those of you who want to dig further below the surface, here is an overview of some of the key things to look at when evaluating a stock. The suggestions are not meant to be a comprehensive guide to everything you should consider. They may also leave you exposed to risks that further research would have identified. They do cover a lot of ground, however.
Valuation Ratios: You simply don’t want to overpay for a stock. Lower valuation ratios (price-earnings, price-to-book, price-to-sales, price-to-free-cash flow, etc.) are better than higher ones. Very high ratios, like price-earnings and price-to-book ratios, can also signal low levels of earnings or book value, respectively.
Earnings Estimates: Look to see if analysts are raising their forecasts (good) or cutting them (bad). Also, check to see if the company is beating forecasts or missing them. Finally, check future growth and the number of analysts making their forecasts available. Are earnings projected to rise or fall? Do the projections reflect the expectations of a single analyst or several analysts?
Financial Statements: There is no substitute for looking at the financial statements. Not just for the current year, but also for past years. Five to seven years of data will give you a good idea of the growth trends in sales, profits, cash flows and dividends. Start with the income statement and then go to the cash flow statement. Look to see if cash from operations is consistently positive (it’s a negative sign if it isn’t) and whether it’s greater than income after taxes (if cash flow is smaller, the company might be aggressive with its accounting practices). Scroll down to, or calculate, free cash flow (cash from operations less capital expenditures). Free cash flow should be positive for most years. Finally, glance at cash from financing. Positive numbers for cash from financing indicate that the company has raised cash either through debt or by selling stock. Jump over to the balance sheet and compare shareholder equity to total liabilities; disproportionately high liabilities imply the company has significant levels of debt.
Financial Ratios: Gross and operating margins will quickly tell you if the company is becoming more or less profitable. Return on assets shows how efficient a company’s management is at using its assets to generate earnings. Companies using share buybacks to reduce the net number of shares outstanding will have positive buyback yields. A decline in total liabilities relative to assets is a sign of a company becoming less reliant on debt.
10-K: The 10-K form is an annual filing required by the U.S. Securities and Exchange Commission (SEC). You can locate it, and other regulatory filings, on the EDGAR database. Scan through the 10-K to understand what the company does and what its potential risks are. If something seems suspicious or otherwise not right, trust your gut and find a different stock to invest in.
Earnings Releases: I find it helpful to look at the 10-K first or in conjunction with the earnings statement. This is particularly the case if the company’s executives are using internal or industry lingo. Determine how the company has performed, the reasons for the performance and what the executives expect to happen in the foreseeable future. You’ll find the earnings releases on a company’s investor relations website. You may also find it useful to read the conference call transcript or listen to it. Replays of the conference calls can often be found on companies’ investor relations websites.
Presentations: Many companies publish slides from their presentations on their investor relations websites [thank the SEC’s Regulation Fair Disclosure (Reg FD) for this]. The slides can provide a good overview of the business and what trends management is seeing.
If this seems like a lot, it’s not. You can do a quick version of this analysis in about 15 minutes. The analysis won’t identify all risks, but it will give you a good sense of whether a stock is attractive. It’s certainly much better than not doing any research or relying on someone else’s opinion. I will add that if you have a few extra minutes and have access to brokerage research, call up the reports to see if there is something important you overlooked.

- Last year, we expanded the list of ratios used to calculate the A+ Quality Grade. My colleague, Wayne Thorp shared the criteria now used.
- Want to do a deeper dive? Here are 16 financial ratios to determine how strong or weak a company is.
- You can determine how sustainable a company’s dividend is by looking at it earnings payout ratio.
- A commonly used valuation metric is EBITDA. Find out more about it in this AAII Journal online exclusive.
- Our next episode of The Individual Investor Show will be aired on May 12. We will discuss how famous investors think, talk about the responses to our Big Question survey on investing mistakes and more.
AAII Sentiment Survey
Pessimism among individual investors about the short-term direction of the stock market rose to its highest level in 11 weeks. The latest AAII Sentiment Survey also shows a decline in bullish sentiment and higher levels of neutral sentiment.
Bullish sentiment, expectations that stock prices will rise over the next six months, dropped 10.1 percentage points to 42.6%. Bullish sentiment was last lower on March 3, 2021 (40.3%). Optimism is above its historical average of 38.0% for the 22nd week out of the past 24 weeks.
Neutral sentiment, expectations that stock prices will stay essentially unchanged over the next six months, rose 4.9 percentage points to 31.8%. Neutral sentiment was last higher on March 3, 2021 (34.4%). Neutral sentiment remains below its historical average of 31.5% for the 63rd time out of the past 67 weeks.
Bearish sentiment, expectations that stock prices will fall over the next six months, increased 5.2 percentage points to 25.7%. Bearish sentiment was last higher on February 10, 2021 (26.3%). Bearish sentiment is below its historical average of 30.5% for the 12th time this year.
At current levels, all three sentiment readings are within their typical historical ranges.
This week’s special question asked AAII members which factors are most influencing their six-month outlook for stocks. Some respondents named more than one factor.
One out of five respondents (20%) say that indications of recovery from the coronavirus pandemic are influencing their outlook for stocks. Likewise, 20% of respondents name the Federal Reserve’s loose monetary policy spending and accelerating national debt as the most influential factor.
This compares to 14% of respondents who name increased possibility of higher capital gains taxes. In addition, about 14% of respondents name inflationary news and pressures. Other factors include earnings results (11% of respondents) the Biden administration’s policies (9%) and high valuations (8%).
Here is a sampling of the responses:
- “Increase in both corporate and personal income taxes will have a negative impact on the stock market.”
- “The administration’s push for additional spending, stirring of inflation and the Fed’s apparent willingness to tolerate it.”
- “Earnings growth, infrastructure investment and coronavirus vaccination percentages.”
- “A tug of war between an economy moving up strongly and the already built-in expectations that it would move up strongly; great results regarding corporate profits versus already high expectations for improving corporate profitability; great current data versus fears of overheating leading to inflation and higher interest rates. The market will go in circles, eventually getting nowhere—for now.”
- “Pandemic recovery and a new approach to our infrastructure. New ideas in our government views on improving the average person’s life. The stimulus monies will move our country for the better.”
Bullish: 42.6%, down 10.1 points
Neutral: 31.8%, up 4.9 points
Bearish: 25.7%, up 5.2 points
Bullish: 38.0%
Neutral: 31.5%
Bearish: 30.5%
See more Sentiment Survey results.

April 22, 2021 I Rebalanced My 403(b) Account This Week
April 15, 2021 The Big Impact the Calendar Is Having
April 8, 2021 Don't Judge an Index Fund by Its Cover
April 1, 2021 Some Valuations Are Too High

Discussion
Barry from TX posted over 5 years ago:
Morningstar used to give a 350 page or so paperback book, "5 Rules for Successful Stock Investing" (2004). to new subscribers to help them understand financials and financial analysis. This article just covered the main points in that book in 2 pages. Thanks for saving us about 10 hours of reading. The book did present some very useful ideas that takes more than 2 pages. It tied all these financial measurements back to the processes and management decisions that generate them to help investors understand how management decisions are based on these measurements and how they present an interrelated picture of the company. The book also provided more detail about what to look for when investing in specific industry sectors . Much of the information is dated, but the logic still applies.
You need to log in as a registered AAII user before commenting.
Create an account