

April Charts of Interest: The S&P 500's Streak Ends
by Charles Rotblut | April 18, 2024
On Monday, April 15, the S&P 500 index ended its streak by falling below its 50-day moving average. I’ll talk about the streak as well as the index’s strong first-quarter 2024 performance. This month’s charts of interest also feature updated interest rate cut expectations, the Big Mac index (yes, that’s a thing) along with “insights” into the financial markets.
All streaks eventually end. Monday was the first time the S&P 500 closed below its 50-day moving average since November 2023. This was the 10th-longest such streak since 1950.
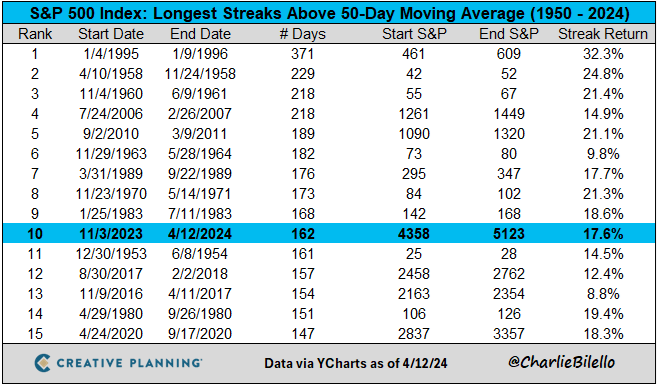
Perhaps It’s Just a Temporary Setback …
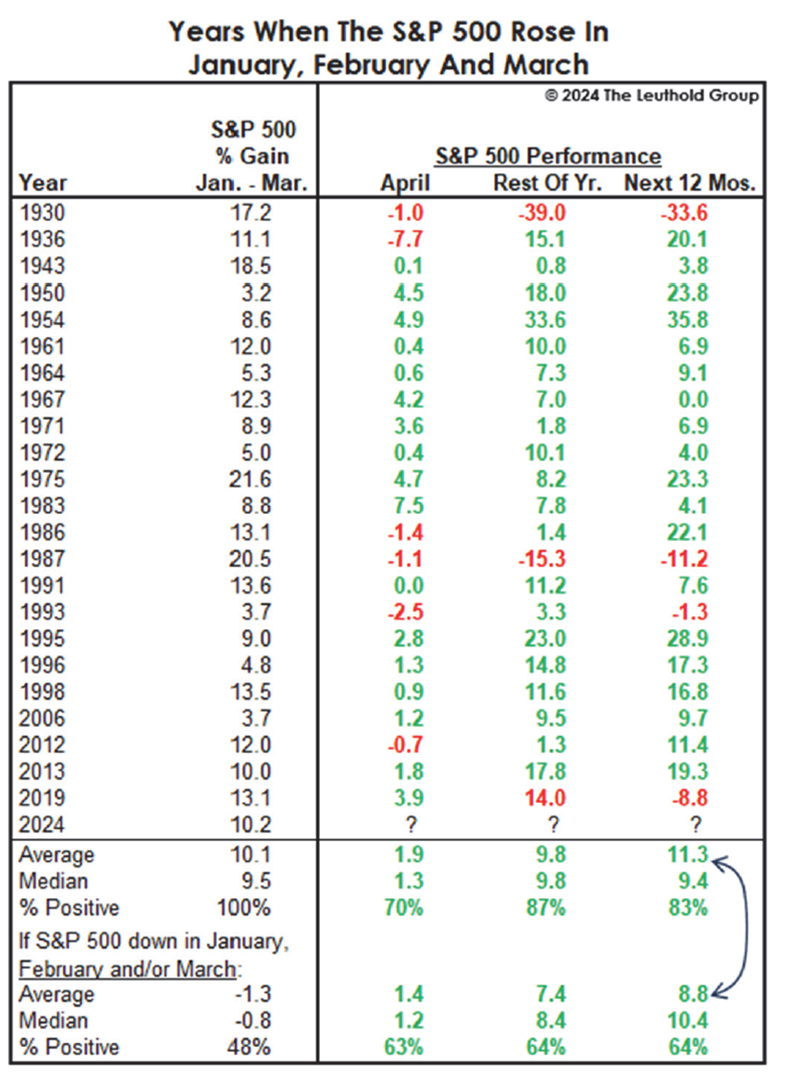
The dip below the 50-day moving average occurred after the S&P 500 posted gains in January, February and March. Stocks don’t continuously move in one direction, so a drop below the trend line was going to happen sooner or later.
The next 12 months could still be good for stocks. The Leuthold Group says the S&P 500 has historically averaged an additional 9.8% gain after rising during the first three months of a calendar year. The average gain since 1926 over the following 12 months has been 11.3%. “Relative to all other years, after a gain in the first three months of the year, the S&P 500’s performance advantage through year-end and the subsequent twelve months is about [2.0%–2.5%],” observed the investment firm.
My, Expectations for Interest Rate Cuts Have Fallen
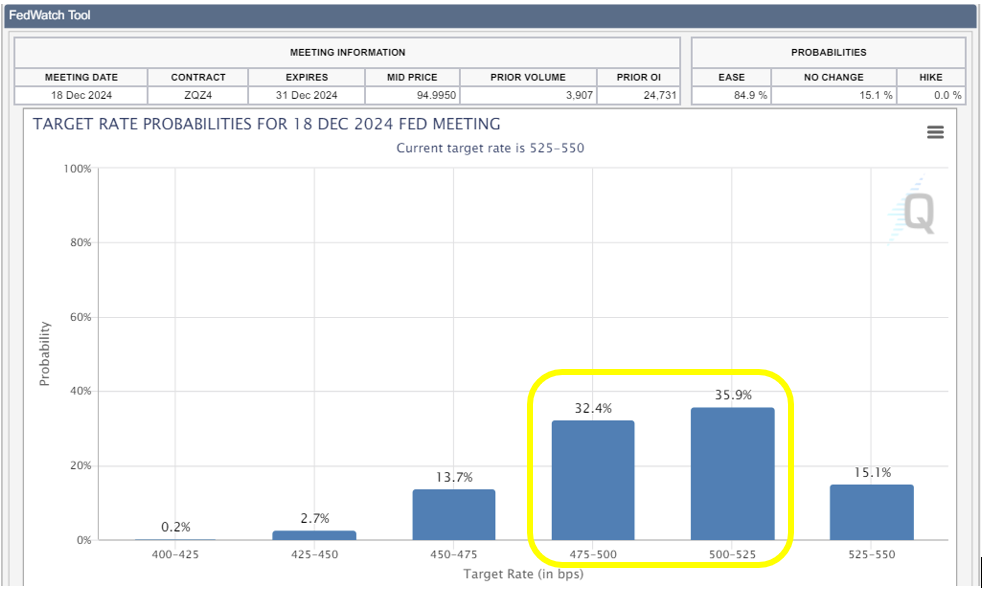
I know the investment media has been hyperfocused on interest rate cuts, so I’m going to simply illustrate the shift in expectations.
First, here is where traders are currently thinking the Federal Reserve’s interest rate target will be at the December 2024 Federal Open Market Committee (FOMC) meeting. The chart is from the CME Group’s FedWatch Tool. As of this morning, traders are now anticipating just two quarter-point (0.25%) interest rate cuts.
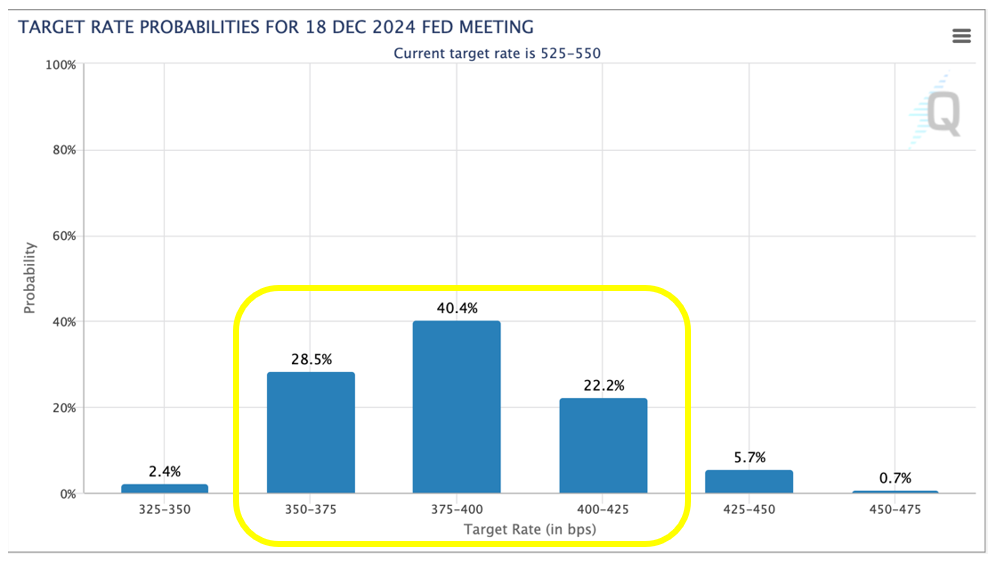
Now, let’s jump into Mr. Peabody’s Wayback Machine and go back to January 2024. Three months ago, traders were anticipating between five and seven interest rate cuts.
Inflation Has Been Stabilizing Instead of Declining
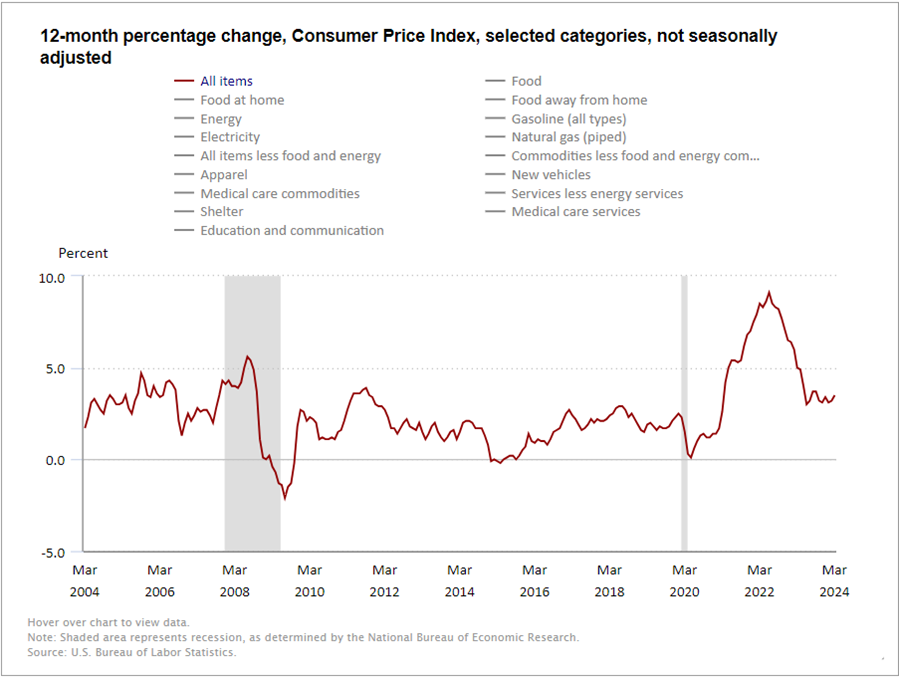
The higher for longer interest rate mentality is being caused, in part, by this year’s consumer price index (CPI) readings. Here is the most recent chart from the U.S. Bureau of Labor Statistics (BLS):
A Big Mac Costs How Much?!
I came across a commentary by researchers at the Federal Reserve Bank of St. Louis about the Big Mac index. The Economist created the index in 1986 to compare the purchasing power of various currencies.
I laughed when I read the commentary because I used the same concept on my Chartered Financial Analyst (CFA) Level 2 and Level 3 exams (in 1998 and 1999, respectively). Specifically, in answering questions about purchasing power parity, I wrote that if the concept holds, then a person shouldn’t be able to buy a McDonald’s burger in Detroit, Michigan, and realize a profit by selling it in Windsor, Ontario, since it should be worth the equivalent in both currencies.
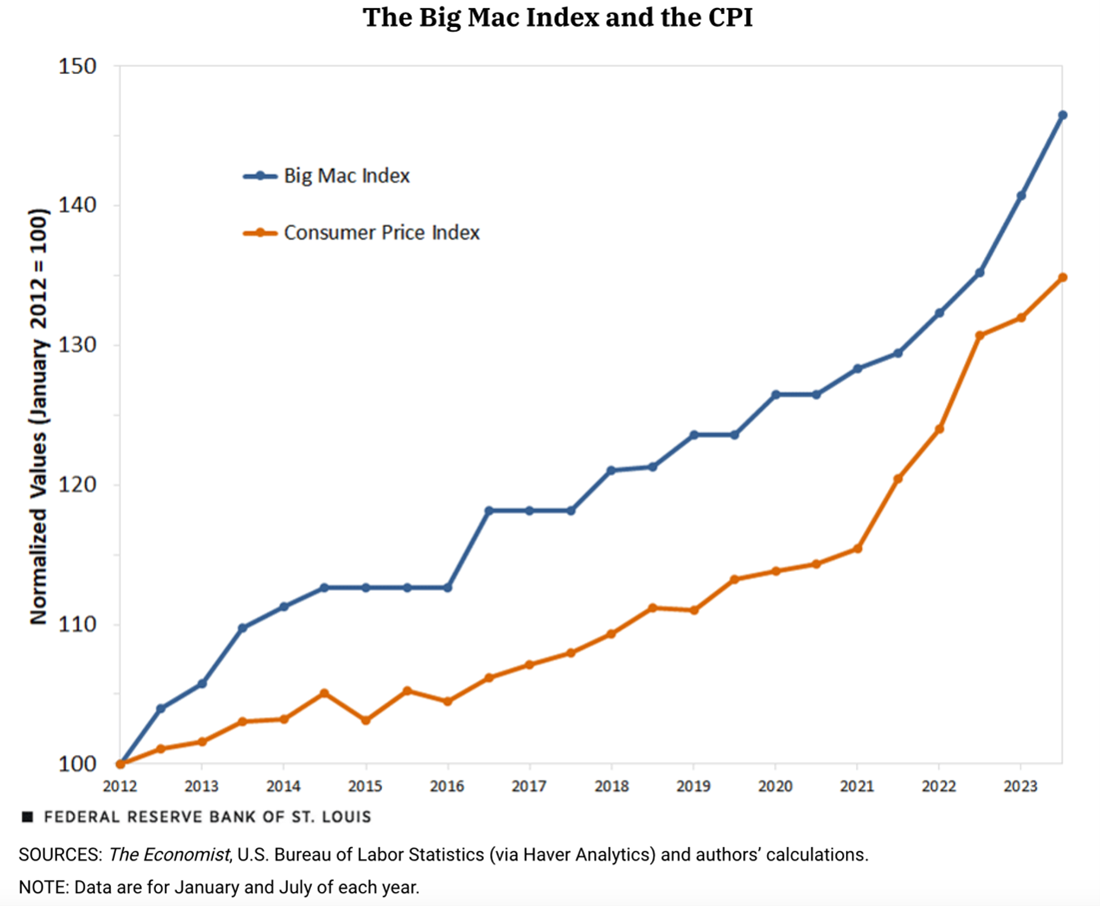
Anyway, the researchers plotted the change in Big Mac prices against the CPI. Fast food prices have risen considerably more than the CPI since 2012. A Big Mac combo meal (a burger, fries and soda) here in Chicago, Illinois, currently costs $14.19!
The Federal Reserve Bank of St. Louis notes that “the subcomponent food away from home represents only 5.4% of the overall CPI using 2022 weights.”
Gold Is Shining Again
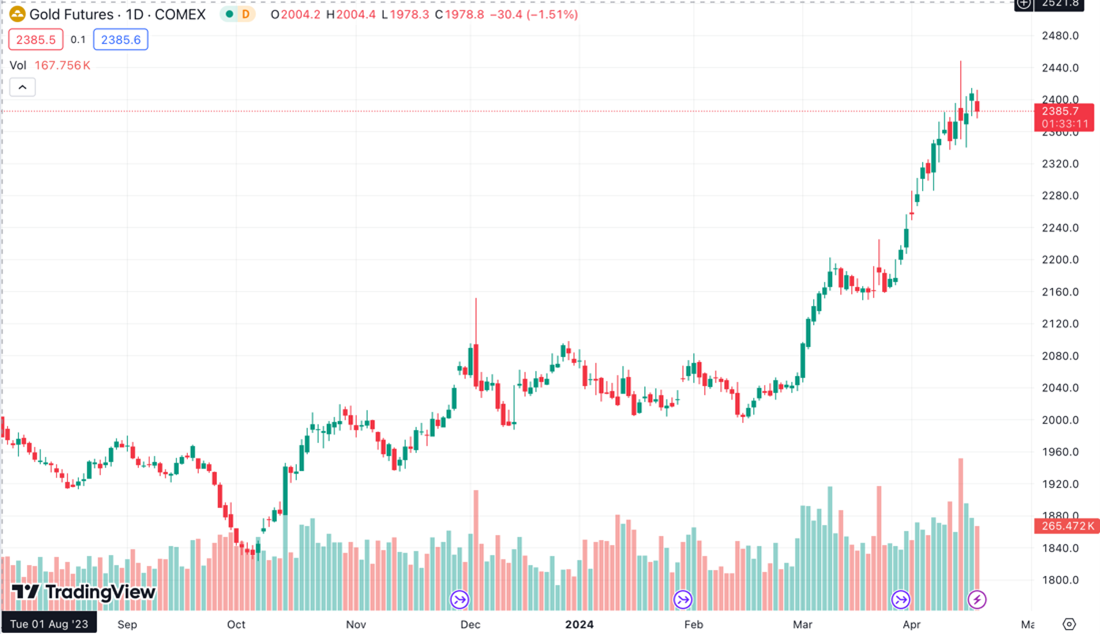
Gold prices have surged more than 15% since the start of March. As of yesterday, the precious metal was trading at an all-time high, as this chart from TradingView shows. (Wells Fargo thinks Costco is selling between $100 million and $200 million worth of gold bars per month.)
Though gold is traditionally seen as a hedge against inflation, the long-term record does not support this.
A Good Description of the Financial Markets
Much energy is spent trying to explain the daily and weekly movements of Mr. Market. Often his moves just reflect the collective emotions of market participants.
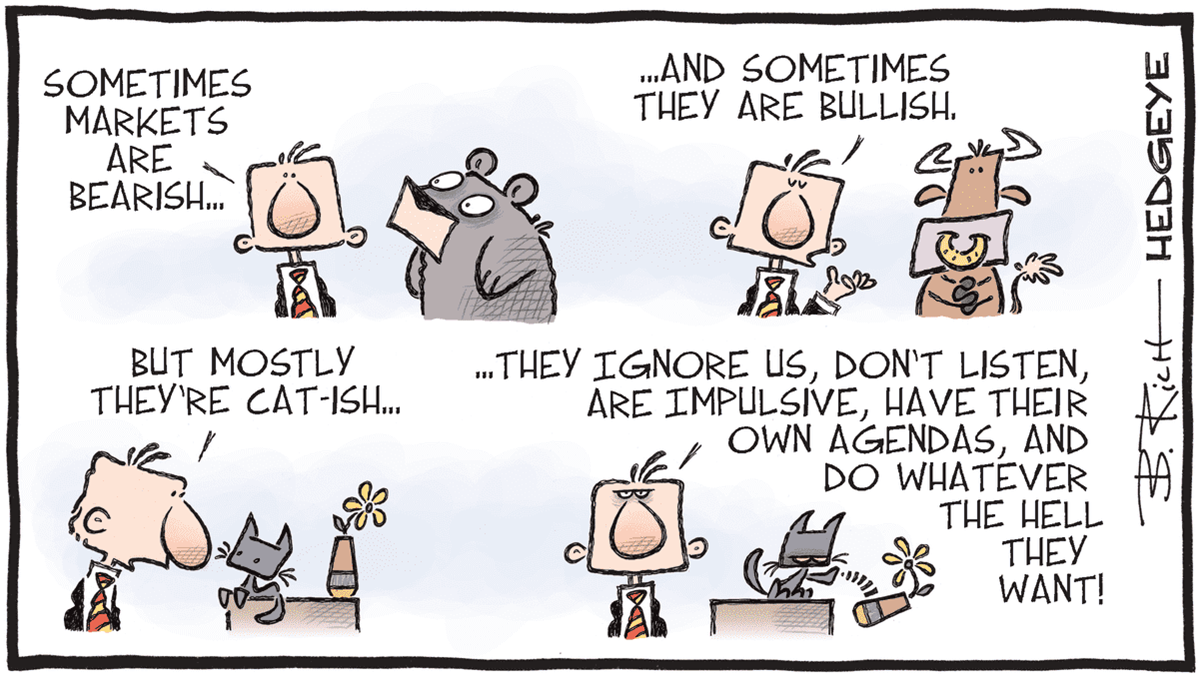
Regardless of which direction Mr. Market goes in, he is apathetic to your goals and needs. Or as the financial website Hedgeye put it recently, Mr. Market has the personality of a cat…

-
Missing the Market’s Worst and Best Months
The market’s best and worst months sometimes cluster together. A trend-following strategy can help investors avoid extreme volatility. -
Investing in Gold
There are several choices for investors who want to add an allocation to gold to their portfolios. What you need to know about the various options. -
A One-Page Wealth-Building Plan for First-Time Homebuyers and Other Short-Term Goals
Saving for goals you want to reach within the next five years entails different risk considerations and allocation choices than long-term goals, as explained in the April AAII Journal.
AAII Sentiment Survey
Pessimism among individual investors about the short-term outlook for stocks surged in the latest AAII Sentiment Survey. Meanwhile, both optimism and neutral sentiment decreased.
Bullish sentiment, expectations that stock prices will rise over the next six months, decreased 5.2 percentage points to 38.3%. Bullish sentiment is above its historical average of 37.5% for the 24th consecutive week.
Neutral sentiment, expectations that stock prices will stay essentially unchanged over the next six months, decreased 4.8 percentage points to 27.8%. Neutral sentiment is below its historical average of 31.5% for the fourth time in five weeks.
Bearish sentiment, expectations that stock prices will fall over the next six months, increased 9.9 percentage points to 34.0%. Pessimism is above its historical average of 31.0% for the first time in 24 weeks. Bearish sentiment was last higher on November 2, 2023 (50.3%).
The bull-bear spread (bullish minus bearish sentiment) decreased 20.8 percentage points to 4.3%. The bull-bear spread is below its historical average of 6.5% for the first time in 24 weeks.
This week’s special question asked AAII members if they think other investors are too bullish or bearish right now.
Here is how they responded:
- They are too bullish: 49.5%
- Their sentiment toward the market is about right: 26.8%
- They are too bearish: 14.0%
- No opinion/not sure: 8.2%
Bullish: 38.3%, down 5.2 points
Neutral: 27.8%, down 4.8 points
Bearish: 34.0%, up 9.9 points
Bullish: 37.5%
Neutral: 31.5%
Bearish: 31.0%
See more Sentiment Survey results.

April 11, 2024 Why Large-Cap Super Micro Computer Is Still in the Small-Cap Russell 2000 Index
April 4, 2024 Five Retirement Challenges and Solutions for Them
March 28, 2024 Remembering Daniel Kahneman
March 21, 2024 March Charts of Interest: The Equal-Weight S&P 500's Unusual Underperformance

Discussion
Barry from TX posted over 2 years ago:
Charles, your Weekly Charts of Interest series is a fresh hit of ABO (Aviators Breathing Oxygen) in an environment dominated by the stale life-threatening exhausts from BIG media “news” sources. Charles, when I read your weekly charts articles, for each chart, I like to ask why this trend happened and estimate the overall theme that unites these disparate data points. Charles, you sometimes hint about what prompted you to choose the charts you display. And, as past posts have demonstrated, I try to estimate what was in your mind when you curated these specific charts (Level 2 thinking). I don’t always find an answer, but your charts exercise my Theory of Mind reasoning skills. Graham (1934), Cloonan (2011), and standard AAII protocols caution investors to ignore “market news,” and focus on their own portfolio (“lache pas la patate” in Cajun) and keep on plodding forward like good Minions (“tenga en pata” in Minion). Charles Dow (1882), J B Williams (1938), and Mandelbrot (1980) started a counter-tradition of asking WHY markets behave as they do. As I read your charts, I like to ask why the trends I see are occurring … and what events produced their structure. In 1935, Lord JM Keynes famously used the London Times weekly beauty contest to demonstrate that the vast majority of people (over 95%) rarely consider more than 2 levels of reasoning when they are competing in a competitive game, like checkers or stock markets, that require them to estimate what other competitors will do with the same information. This, and the mathematics of the normal distribution, are the theories that underly Fama’s Efficient Market Hypothesis (1986). Level 1 thinkers (different from Cloonan’s Level 1 thinkers) will estimate that that the average is the most likely answer. Level 2 thinkers will consider this happened and then will estimate that half the average or 25% is closer to the final group estimate, and so on, so the final asymptote approaches a zero. This is now called Theory of Mind studies. TOM levels reflect levels of mental effort. The TOM process tests the number of levels of reasoning people will exert to understand new information before they give up. Around Level 3 – (L1) estimating what information the chats convey, (L2) estimating what information they convey in the aggregate, and (L3) estimating the reasoning of Charles's curation process --- is where I get a brain cramp and turn to the refuge of a cup of coffee to restore my sanity. Thank you, Charles. Now I can ignore the financial news in peace.
Barry from TX posted over 2 years ago:
Charles, The one chart I have a comment on is the Gold Is Shining Again chart. The spot market price of gold is around $2,400 per ounce. The price of a Cosco gold bar is $2,350. The spot market price of a 1907 St Gaudens Double Eagle $20 gold piece is as low as $2,450. If you have never held one, they impart emotions that approximate what it feels like to be "rich" in the PRISM aspirational statements I have reviewed. The price difference is more than a "just noticeable" difference. Pass on the Costco pastiche. Buy the memory.
You need to log in as a registered AAII user before commenting.
Create an account