

March Charts of Interest: The Equal-Weight S&P 500's Unusual Underperformance
by Charles Rotblut | March 21, 2024
Featured Tickers: GPN
GPN
We’re constantly striving to enhance your experience, and your feedback is crucial in guiding our efforts. As a valued subscriber, you are invited to participate in our brief net promoter score (NPS) survey. It’s a simple way for you to share your thoughts and help us improve. Together, we can continue to create a more engaging and fulfilling experience for you. Click here to take the survey and make your voice heard.
In this month’s charts of interest, I’m revisiting the impact that the Magnificent Seven technology-related stocks are having on the S&P 500 index, though in a different manner than previously. I will also share some insights regarding inflation and interest rates before ending with a unique “dogs of the Dow.”
The S&P 500 Equal Weight index has held a long-term return advantage over the market-capitalization-weighted S&P 500. Over the short term, it has experienced periods of outperformance and underperformance like any other index. What is happening now, though, is very unusual.
“Before last month, the equal-weight S&P’s rolling calendar-year returns had never underperformed the cap-weighted version of the index this badly over the last 20 years,” observed DataTrek Research. “In other words, we are in unprecedented territory here.”
The significant gains by the Magnificent Seven are a big reason for the severity of the equal-weight index’s underperformance. They’re not the only reason though. Right now, market cap is winning in other sectors too: “Most (8 out of 11) of the equal weighted S&P sectors have lagged their cap-weighted counterparts.” The equal-weight index holds the same stocks as the market-cap-weighted index. The only difference is the amount of influence each individual stock has on the respective indexes’ returns.

Source: DataTrek Research.
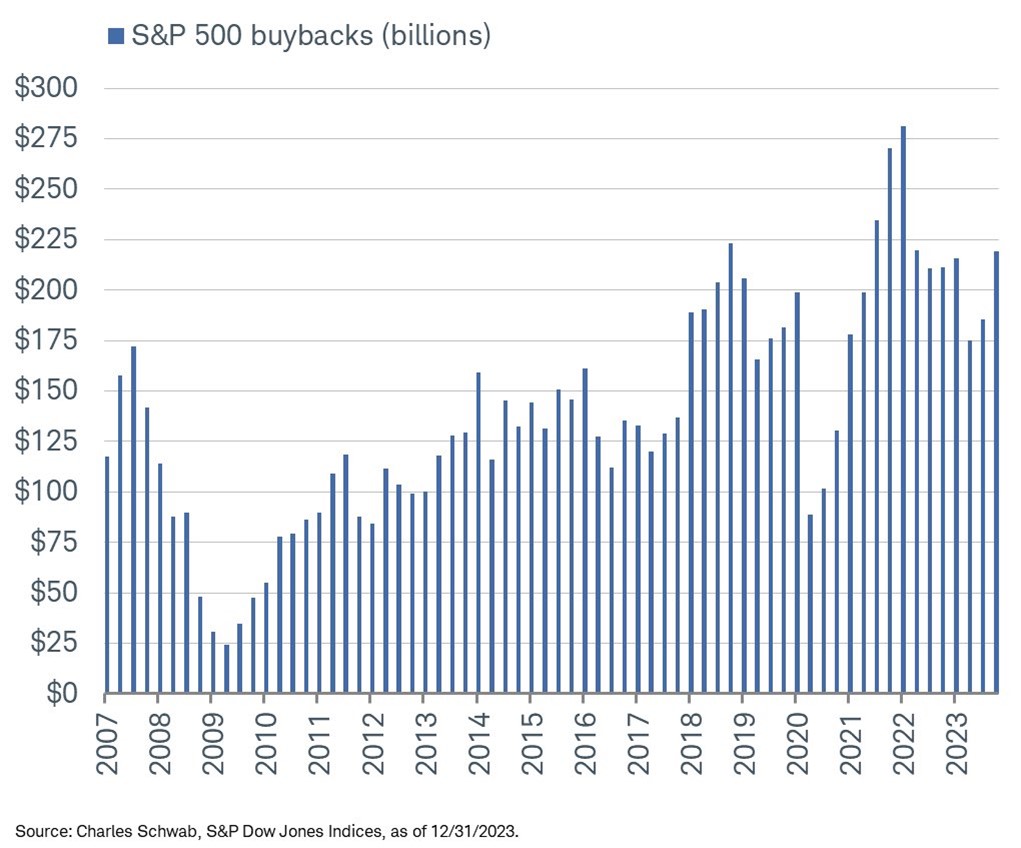
Buybacks Bounced to a Three-Year High
Preliminary data from S&P Dow Jones Indices shows stock buybacks bouncing back strongly in the fourth quarter of 2023. As Charles Schwab chief investment strategist Liz Ann Sonders observed, the 20 largest companies in the S&P 500 accounted for 54.1% of the total amount of buybacks. Those companies spent $118.6 billion on stock buybacks during fourth-quarter 2023 versus $100.5 billion for the other 480 companies in the S&P 500 combined.
Hidden gem: If you scroll down on the S&P Dow Jones Indices’ S&P 500 page to “Additional Info,” you will find all sorts of details about the large-cap index.
Concentration in the S&P 500 Continues to Increase
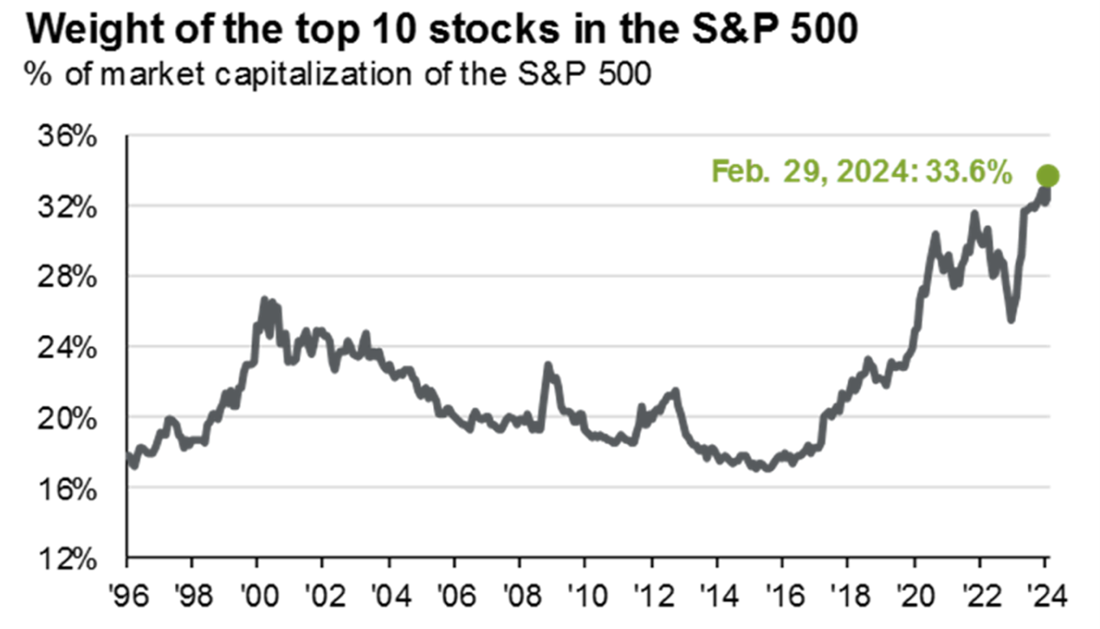
I’m providing an updated look at the S&P 500’s concentration to add some context to the last two charts. The 10 largest stocks accounted for one-third of the S&P 500’s total market cap at the end of February 2024, according to J.P. Morgan Asset Management’s Guide to the Markets.
Source: J.P. Morgan Guide to the Markets.
Stock Valuations Are Continuing to Converge With Bonds
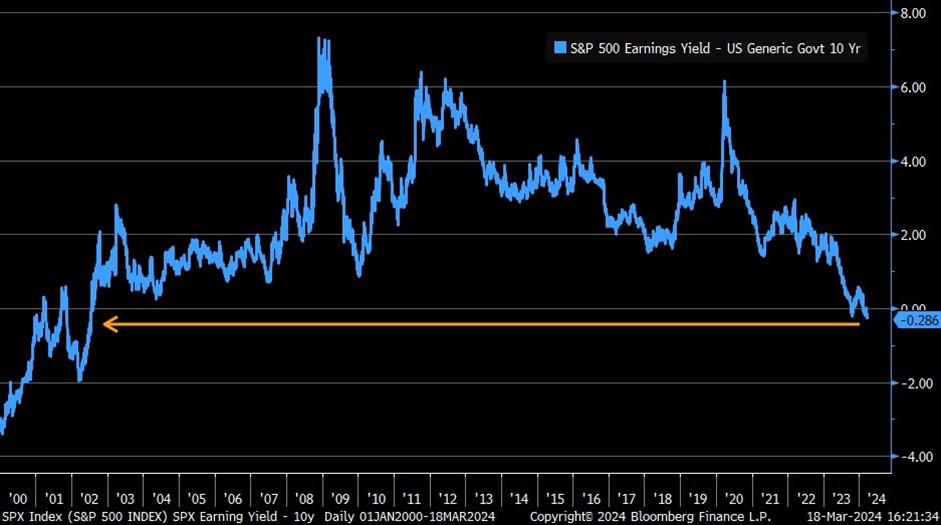
One method for assessing the relative valuation of stocks is to compare their earnings yields to the yields on bonds. The earnings yield is the inverse of the price-earnings ratio, meaning earnings to price (E/P) instead of price to earnings (P/E). The cheaper asset is the one with the higher yield.
On March 19, Sonders tweeted that the spread between the S&P 500’s earnings yield and the 10-year U.S. Treasury bond’s yield has fallen to the lowest level since July 2002. This is a continuation of a convergence we pointed out one year ago in the April 2023 AAII Journal.
Twofers Are Good for the Stock Market
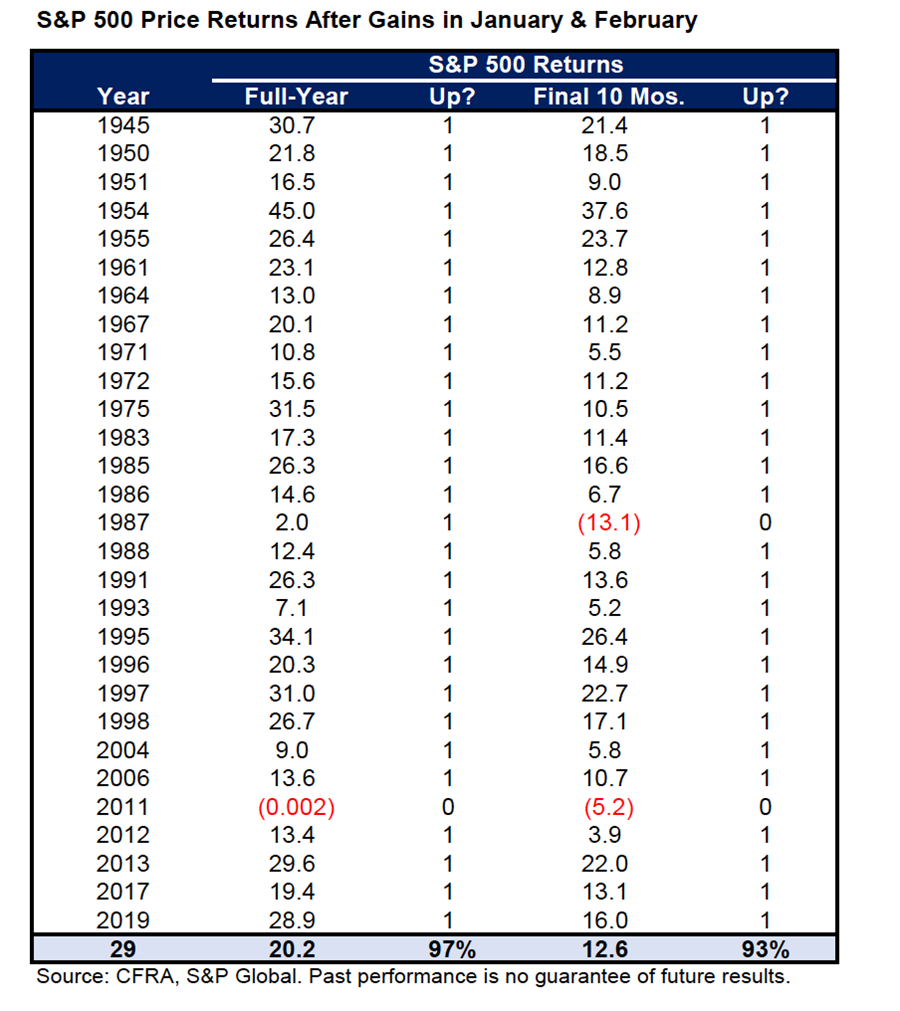
“The S&P 500 recorded positive full-year price returns 97% of the time when it was up in the first two months of the year,” observed Sam Stovall of CFRA Research. The S&P 500 achieved such a twofer this year with gains realized in both January and February. It was the 30th time since World War II that the large-cap index began a year with a two-month winning streak.
The gain for the S&P 500 over the following 10 months has averaged 12.6%. Only 1987 and 2011 incurred losses over the final 10 months.
Two, Three or Four Interest Rate Cuts This Year?
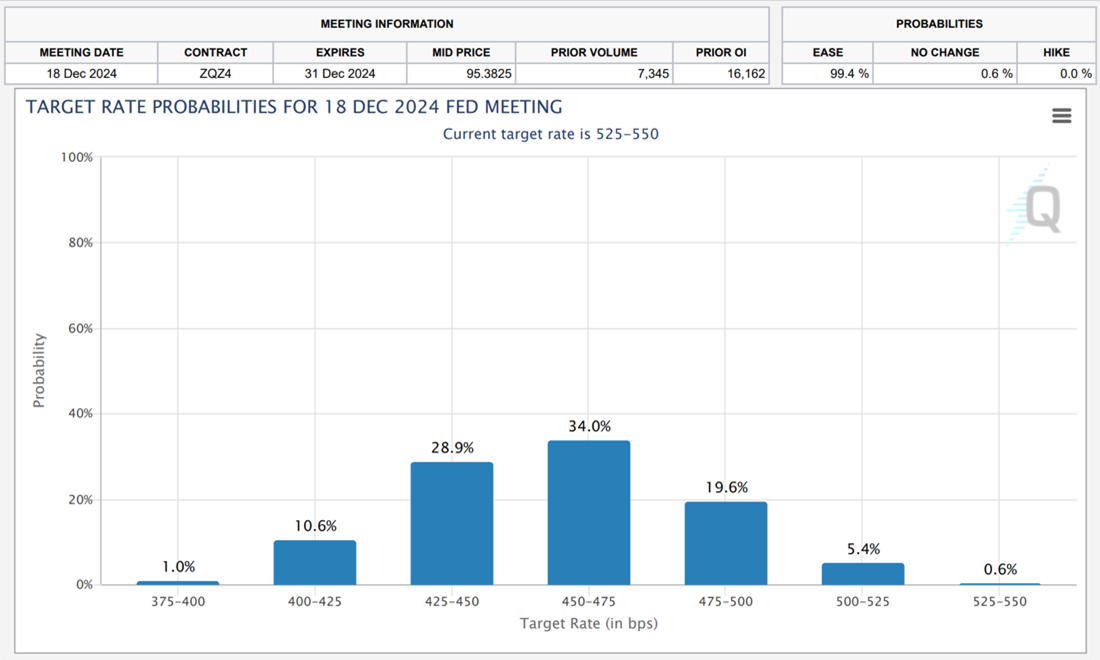
Yesterday’s projections (aka “the dot plot”) released by the Federal Open Market Committee (FOMC) suggest that there will be three quarter-point (0.25%) interest rate cuts occurring later in 2024. As of this morning, the CME FedWatch tool shows traders pricing between two and four interest rate cuts into the federal funds futures. Notably, there is a 0.6% chance of no interest rate cuts priced in and a 1.0% chance of six interest rate cuts.
Rising Interest Rates Have Issuers Looking at Convertibles
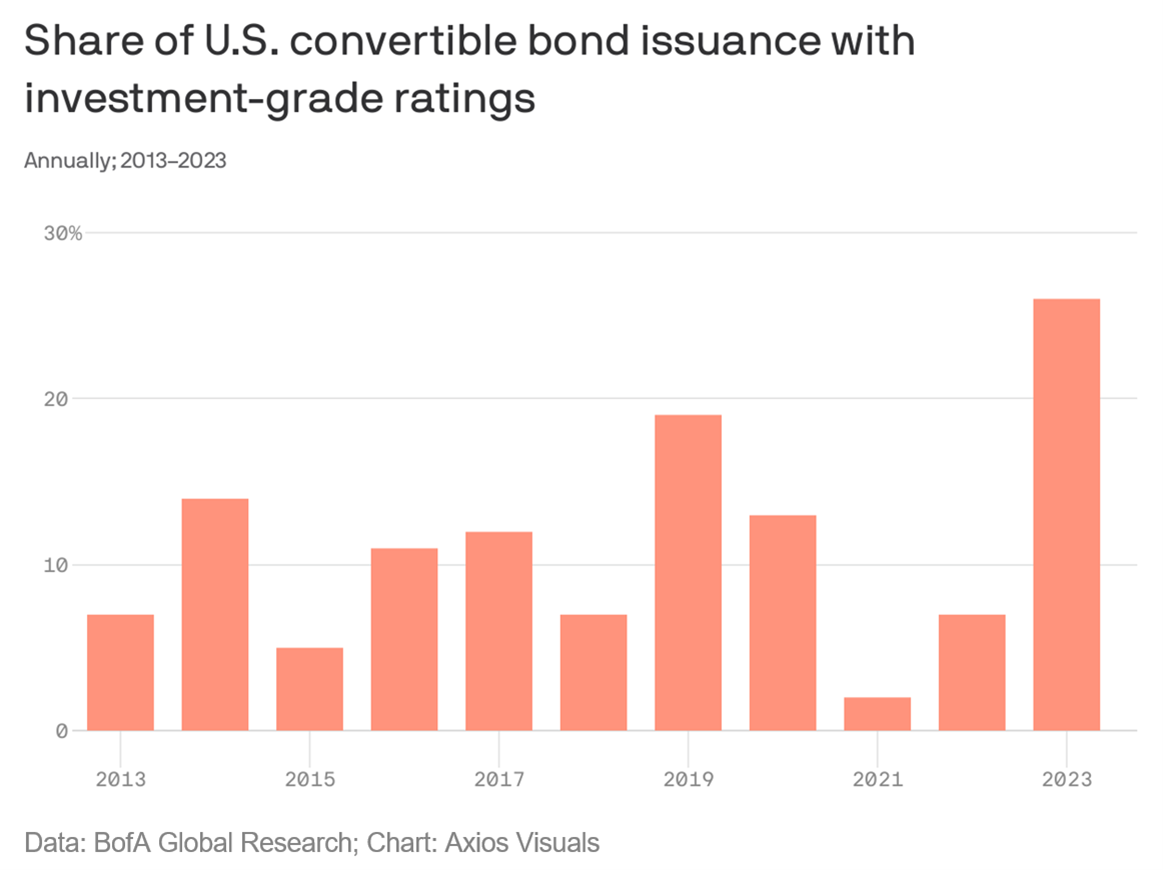
A record share of convertible bond offerings last year were from established companies with investment-grade credit ratings. Interest rates are why. Some investment-grade companies are finding it cheaper to issue convertibles than to issue traditional bonds.
Here’s an example from Axios: “Global Payments Inc.  (GPN), an [investment-grade] payments technology company with a $34 billion market cap that’s been public since 2001, placed a $2 billion convertible bond last month—with a 1.5% coupon. In comparison, the company’s existing senior notes yield about 5.5%—a proxy for how much it would have to pay if [it] issued regular old bonds.”
A Longer-Term Look at Inflation
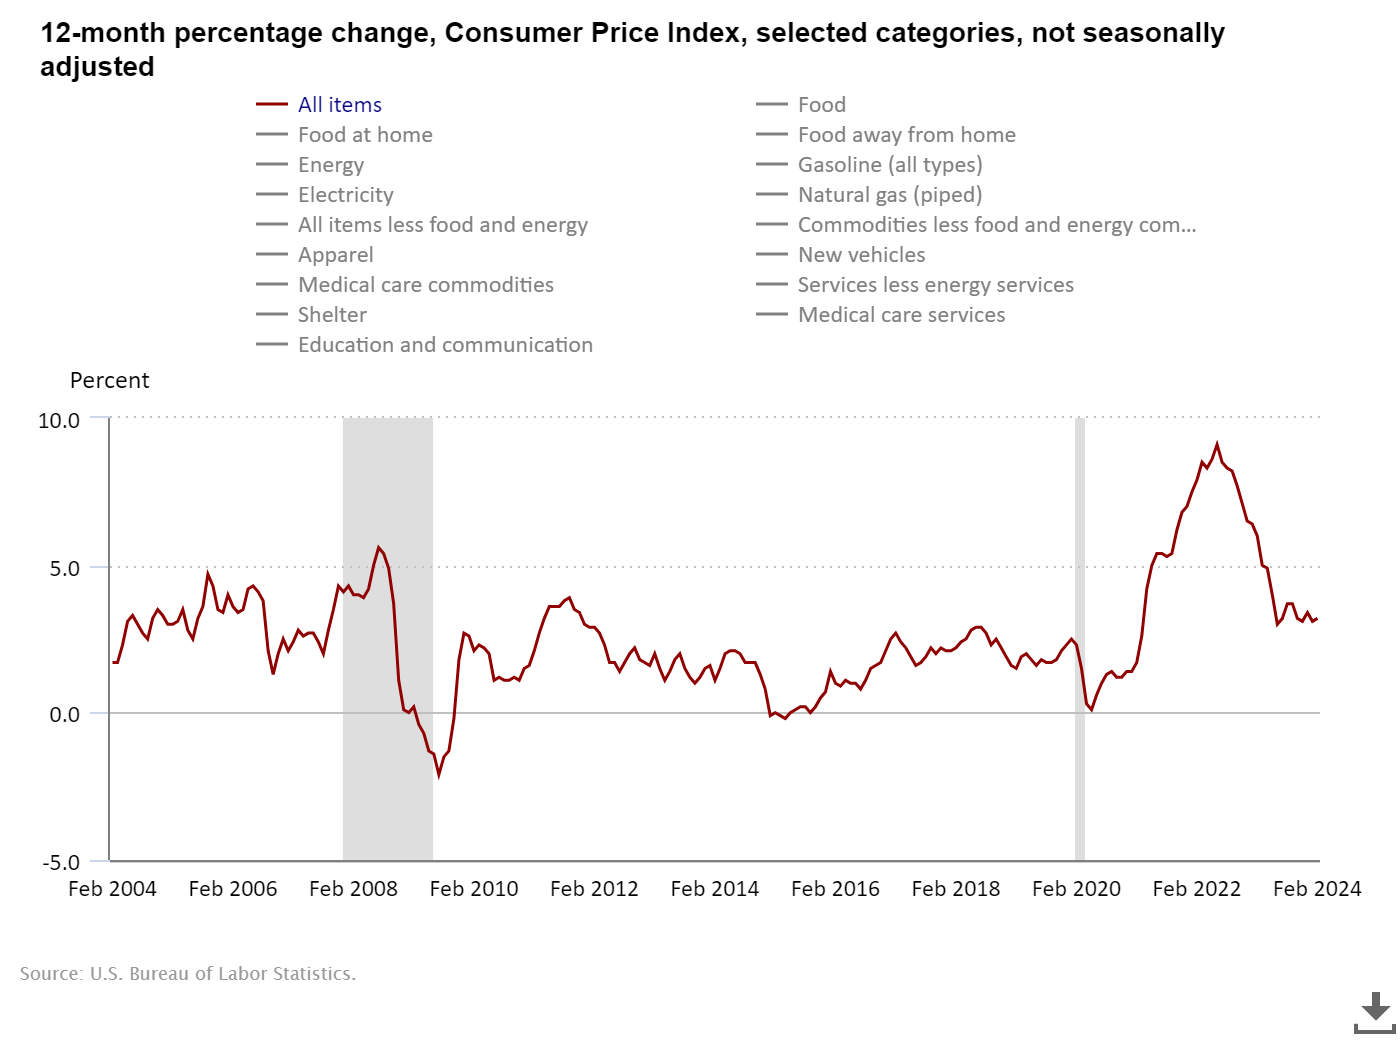
I looked at the longer-term inflation data while working on an article for the April 2024 AAII Journal. Consumer price inflation is continuing to come down overall from last year’s peak, even with the recent bumpiness. The chart below is from the U.S. Bureau of Labor Statistics.
Is Inflation the New Status Symbol?
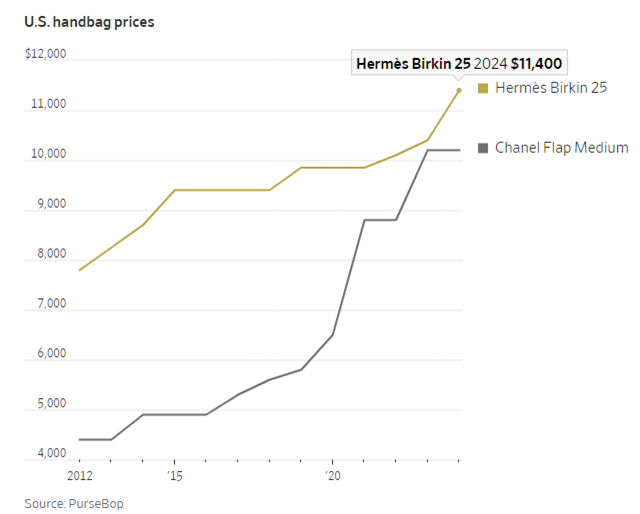
The notoriously hard-to-get Hermes Birkin handbag is getting even more expensive. The Wall Street Journal says Hermes recently raised the price of “a basic Birkin 25-centimeter handbag in its U.S. stores by 10% to $11,400.” This is the largest price increase in more than one decade.
Competition may be a reason, notes The Wall Street Journal. Competitor Chanel “has jacked up the price of its most popular handbag by 75% since before the pandemic.” Hermes wants to keep its status of offering the most expensive handbag.
On Tuesday, two individuals filed an antitrust lawsuit against Hermes. They allege that Hermes is exploiting its position as the sole manufacturer of Birkin bags “by requiring consumers to purchase other, ancillary products from [the company] before they will be given an opportunity to purchase a Birkin handbag.”
The Dogs of the Dow
We’ll end with eToro U.S. investment analyst Callie Cox’s experience with artificial intelligence (AI). While AI hasn’t mastered math—as I pointed out last month—it does better with dogs. Cox asked AI to “show me Wall Street with pugs as traders.”


-
Exposure to the Size Factor Drives Equal-Weight Outperformance
Examining the key drivers of equal-weighted portfolios outperforming value-weighted portfolios over multiple decades. -
Stock and Bond Yields Are Converging
The earnings yield is frequently used to assess the valuation of stocks compared to the valuation of bonds. -
Do Convertible Bonds Fit Into Your Portfolio?
Convertible bonds have both bond-like and stock-like features. Issuing convertible bonds is a way to offer a low coupon yield, but entice investors with a value-added component. -
Gaining Small-Cap Exposure Via Mutual Funds and ETFs
Small-cap mutual funds and ETFs can add diversification to your domestic stock investments.
AAII Sentiment Survey
Pessimism among individual investors about the short-term outlook for stocks significantly increased in the latest AAII Sentiment Survey. Meanwhile, both optimism and neutral sentiment decreased.
Bullish sentiment, expectations that stock prices will rise over the next six months, decreased 2.7 percentage points to 43.2%. Bullish sentiment is above its historical average of 37.5% for the 20th consecutive week.
Neutral sentiment, expectations that stock prices will stay essentially unchanged over the next six months, decreased 2.6 percentage points to 29.6%. Neutral sentiment is below its historical average of 31.5% for the sixth time in eight weeks.
Bearish sentiment, expectations that stock prices will fall over the next six months, increased 5.3 percentage points to 27.2%. Bearish sentiment is below its historical average of 31.0% for the 20th consecutive week.
The bull-bear spread (bullish minus bearish sentiment) decreased 8.0 percentage points to 16.0%. The bull-bear spread is above its historical average of 6.5% for the 20th consecutive week.
This week’s special question asked AAII members about the Federal Reserve’s decision to keep interest rates unchanged.
Here is how they responded:
- It was the right decision: 76.6%
- They should have raised rates: 11.2%
- They should have cut rates: 5.6%
- Not sure/no opinion: 6.3%
This week’s Sentiment Survey results:
- Bullish: 43.2%, down 2.7 percentage points
- Neutral: 29.6%, down 2.6 percentage points
- Bearish: 27.2%, up 5.3 percentage points
Historical averages:
- Bullish: 37.5%
- Neutral: 31.5%
- Bearish: 31.0%
Bullish: 43.2%, down 2.7 points
Neutral: 29.6%, down 2.6 points
Bearish: 27.2%, up 5.3 points
Bullish: 37.5%
Neutral: 31.5%
Bearish: 31.0%
See more Sentiment Survey results.

March 14, 2024 A Luncheon With Cathie Wood of ARK Invest
March 7, 2024 Dividend Stocks Yielding 10% or More
February 29, 2024 Warren Buffett on Why You Shouldn't Trust Forecasts
February 22, 2024 February Charts of Interest: The Impacts of Inflation and Interest Rates

Discussion
John L from NJ posted over 2 years ago:
The first chart is not convincing evidence of the long term return advantage for an equal capital weighted index versus the S&P 500. Trends can continue for very long periods before they reverse. It appears that in the very long term no stock category has a permanent advantage. Perhaps Cloonan was wrong in his book "Investing at level 3". Because if Small Cap, Micro Cap, REITs, or Value had permanently superior returns; why would anyone invest in the remaining equity market segments?
Rob from NC posted over 2 years ago:
The chart under "A Longer-Term Look at Inflation" is absolutely meaningless without time periods on the horizontal axis. Doesn't anyone LOOK at these charts before they're published?
Charles Rotblut from Illinois posted over 2 years ago:
Rob,
The time periods from Feb 2004 through Feb 2024 are appearing on my screen. Are they not showing up on yours?
-Charles
Charles Rotblut from IL posted over 2 years ago:
Rob,
After looking at the chart closer, the downloadable images from the Bureau of Labor Statistics cut the calendar year labels on the bottom horizon short. My staff replaced the original chart with a screenshot.
-Charles
Barry from TX posted over 2 years ago:
Charles, the DataTrek chart on EW SPX trends vs CW SPX trends may not prove anything long-term about which is a superior indicator to watch, but the spikes in the data for 2021-2023 (call it the Great M7 Concentration) “highly resemble” the spikes in the data for 2008-2011 (aka The Great Recession) and it’s underperformance “fallout” level is tailing downward to the 20% underperformance level while the 2008-2011 underperformance leveled off at the 5%. The DataTrek assessment, “We are in unprecedented territory here,” understates the magnitude of the impact of this performance gap. Charles your assessment – “What is happening now is very unusual -- is more realistic. #1 One possible impact is that many ETFs use the MC SPX as their target performance benchmark. #2 The “500” in SPX 500 are the largest capitalized companies in the US. #3 As DataTrek observed, “Most (8/11) of the EW SPX sectors have lagged CW counterparts.” #4 One of my “preferred” data analysts, SCHW’s Liz Ann Sonders observed that the 20 largest (4% of SPX) spent $118B (54% of the total or nearly twice as much ) during one quarter (4Q23) vs $100B for the other 96% of SPX. #5 3/19/24, Sonders spotted that the SPX earnings yields and UST10 yields spread had fallen to the lowest level since July 2002 and observed that this was a continuation of a convergence AAII had pointed out a year ago in 04/23 in the AAII Journal. #6 AAII Bearish sentiment is UP 5.3% @ 27.2% > LT HA @31.0% 20/20 WOW #7 The BB Spread DOUBLED 8.0% to @16.0% >HA @6.5% 20/20 WOW. #8 That AAIIers saw the FOMC decision to “punt on 1st down” was “right” and showed that a large majority (76.6%) are “wrong way betters” who prefer to bet the economy will not make its “point” – inflation will cool – and FOMC will continue rolling the dice. Charles, these “horror-house mirror” and casino distortions reflect the magnitude of the DEPTH and BREADTH of concentrated over/underperformance in an economy that is bifurcated into winners and losers. What do these grotesque distorted “illusions” mean to investors in the near-term short-term? Whatever it is, it can’t be good for some. The trend either continues or reverts to the mean (that’s my bet). Both are bad for some bettors at the same table. Maybe that’s why some prefer “funhouses” reflections and rollercoaster thrills to other midway shows like guessing your weight. Any opinions?
Ken from NC posted over 2 years ago:
Is the "Dogs of the DOW" picture available as a poster?
You need to log in as a registered AAII user before commenting.
Create an account