

Reasons for Not Selling Stocks This May
by Charles Rotblut | May 02, 2024
The S&P 500 index is extending its streak of avoiding large daily downward moves. This streak of lower downside volatility adds to the reasons for not selling in May even with higher-for-longer interest rates.
The last time the S&P 500 fell by 2% on a daily basis was February 21, 2023. The large-cap index closed down by 2% that day (technically, 2.004%). This appears to be the longest such streak since the 17-month streak between September 9, 2016, and February 2, 2018.
This year is also on track to be below average in terms of days with a move of 1% or more. The S&P 500 has realized a daily gain or loss of 1% or more just 17 times so far (10 days up and seven days down). This compares to a post-global financial crisis average of 60 such days per year.
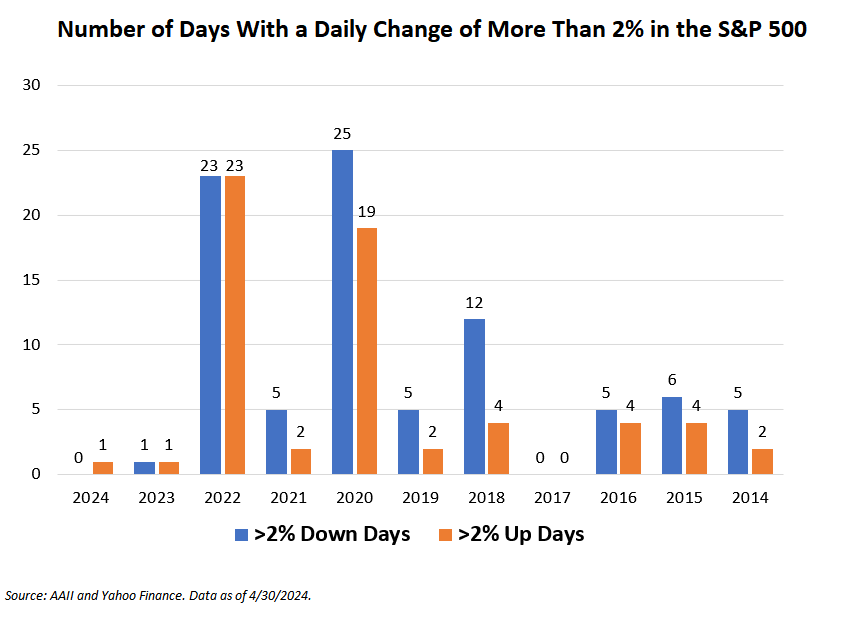
It’s always easier to sleep at night when there isn’t much downside volatility. While drops are a normal part of the market cycle, periods of calm make it psychologically easier to maintain an allocation to stocks.
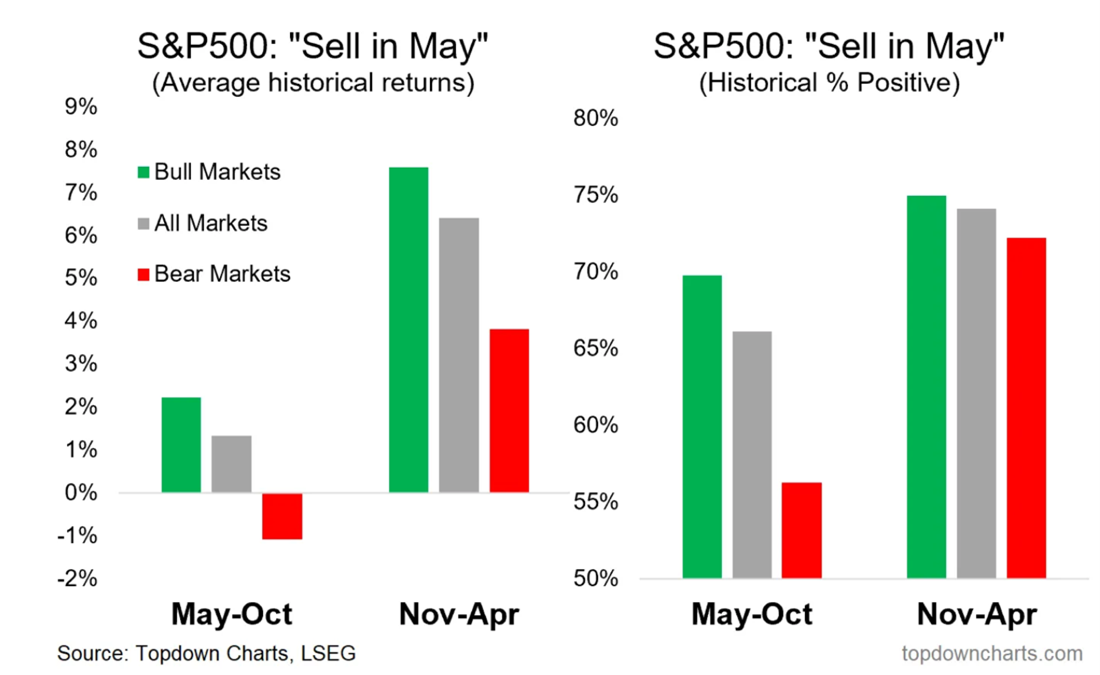
I point this out because the “worst six months” period for stocks has started. Since 1945, the S&P 500 has averaged a modest 1.6% return between May and October, according to CFRA Research’s Sam Stovall. In contrast, the S&P 500 has realized an average gain of 6.8% during the “best six months” of November through April.
The moniker “worst six months” is relative since stocks still rise in value, on average. The moniker is also dependent on market conditions.
Topdown Charts’ Callum Thomas found that the S&P 500’s odds of losing money during the May through October period are largest when the index is trading below its 200-day moving average trendline. Thomas describes such conditions as a “bear market.”
The S&P 500 is currently above its 200-day moving average and remains solidly in a traditionally defined bull market.
Economic growth is one factor underlying the higher-for-longer interest rate environment, the S&P 500’s continued below-average volatility and the large-cap stock’s bull market. This growth has been a double-edged sword. It helps corporate earnings but is also a contributor to inflation’s lack of further declines this year.
From the standpoint of selling in May, an investor could certainly top a 1.6% six-month return by selecting the right savings account or money market fund. This, of course, assumes that the returns over the current six-month period won’t be better than average. It also ignores transaction costs and potential tax implications.
Most importantly, there is the risk of you not rotating back into stocks to capture whatever gains occur during the next best-six-months period. Reducing the odds of mistakes is among the top ways of boosting your long-term returns.

-
The S&P 500 at 5,000: Don’t Be Fooled by Point Hype
There is an obvious difference between point moves and percentage changes -
The Relationship Between Stock Market Volatility and Returns
Less volatility isn’t always a good thing, especially when considering the returns that follow periods of high volatility. -
Winning the Battle Against Investment Fees and Biases
Just released: The May AAII Journal shows you how to arm yourself with the tools you need to keep as large a share as possible of your investment returns.
AAII Sentiment Survey
Optimism among individual investors about the short-term outlook for stocks rose in the latest AAII Sentiment Survey. Meanwhile, pessimism and neutral sentiment decreased.
Bullish sentiment, expectations that stock prices will rise over the next six months, rebounded 6.4 percentage points to 38.5%. Bullish sentiment is above its historical average of 37.5% for the 25th time in 26 weeks.
Neutral sentiment, expectations that stock prices will stay essentially unchanged over the next six months, decreased 4.9 percentage points to 29.0%. Neutral sentiment is below its historical average of 31.5% for the fifth time in seven weeks.
Bearish sentiment, expectations that stock prices will fall over the next six months, decreased 1.4 percentage points to 32.5%. Pessimism is above its historical average of 31.0% for the third consecutive week.
The bull-bear spread (bullish minus bearish sentiment) increased 7.8 percentage points to 6.0%. The bull-bear spread is below its historical average of 6.5% for the third consecutive week.
This week’s special question asked AAII members if they believe gold’s recent record high prices are sustainable over the next year.
Here is how they responded:
- Gold prices will increase further: 23.6%
- Yes, gold prices will stabilize at current levels: 17.6%
- No, gold prices will decrease moderately: 29.6%
- No, gold prices will significantly drop: 3.8%
- Don’t follow gold prices/no opinion: 25.1%
Bullish: 38.5%, up 6.4 points
Neutral: 29.0%, down 4.9 points
Bearish: 32.5%, down 1.4 points
Bullish: 37.5%
Neutral: 31.5%
Bearish: 31.0%
See more Sentiment Survey results.

AAII Asset Allocation Survey
Individual investors’ allocations to equities slightly increased in the April Asset Allocation Survey.
Stock and stock fund allocations increased 0.1 percentage points to 69.4%. Stock and stock fund allocations are above their historical average of 61.5% for the 47th consecutive month. Stock and stock fund allocations were last higher in April 2022 (69.8%).
Bond and bond fund allocations decreased 0.1 percentage points to 13.9%. Bond and bond fund allocations are below their historical average of 16.0% for the third time in six months.
Cash allocations decreased 0.1 percentage points to 16.6%. Cash allocations are below their historical average of 22.5% for the 17th consecutive month.
- Stocks and Stock Funds: 69.4%, up 0.1 percentage points
- Bonds and Bond Funds: 13.9%, down 0.0 percentage points
- Cash: 16.6%, down 0.1 percentage points
- Stocks: 30.9%, up 0.5 percentage points
- Stocks Funds: 38.5%, down 0.3 percentage points
- Bonds: 4.7%, up 0.1 percentage points
- Bond Funds: 9.3%, down 0.1 percentage points
- Stocks/Stock Funds: 62.0%
- Bonds/Bond Funds: 16.0%
- Cash: 22.0%
Take the Asset Allocation Survey.
April 25, 2024 The Benefits and Costs of Diversification in My 403(b)
April 18, 2024 April Charts of Interest: The S&P 500's Streak Ends
April 11, 2024 Why Large-Cap Super Micro Computer Is Still in the Small-Cap Russell 2000 Index
April 4, 2024 Five Retirement Challenges and Solutions for Them

Discussion
Rob from NC posted over 2 years ago:
Interesting but irrelevant. Those who chase short-term movements likely shoot themselves in the long-term foot.
Barry from TX posted over 2 years ago:
As I was writing one of my characteristically fully expository analyses of Charles' "Stay after May" premise, I received a copy of Warren Buffett's 2024 Letter to Shareholders. As Lily Tomlin's 60's Laugh-In character Emily Litella always said, "Never mind." North Carolina Rob's pithy 15-word comment summarizes Buffett’s thoughts over 42 pages. No surprises there. Rob is a Buffett fan with a shared long-term view. What is surprising in Buffett's 2024 remarks is his repeated focus on the limitations he foresees for future BRK growth due to the lack of targets of opportunity both in the US and abroad. BRK is a victim of its own success. Net assets of $561B and cash on hand of $168B are so large that the size of the denominator in any financial ratio reduces the percentages for future growth which places BRK at a disadvantage in comparisons. And the targets for added growth aren't there to deploy the cash. Buffett is still the Head Cheerleader for Capitalism. The US is still the best (maybe only in his opinion) place to invest. US markets are still the best (maybe only in his opinion) places to achieve future returns, but opportunities for buying or investing in other companies aren't there right now. What does this mean for BRK stock prices? That's a question Charles' timely column addresses. The BRK report may have dimmed the spotlights on M7 (now M3), AI generative or not, and semiconductors (US or not). I await Charles' trenchant analysis. PS, I cannot resist the temptation to post my "It's the economy, stupid" comments I interrupted to do this one.
Barry from TX posted over 2 years ago:
Charles, a very timely topic, however, the data points in these charts are not going to reduce my use of Night-time Tylenol. #1 Chart #1 needs to show the related EOY SPX performance so we can estimate the overall relationship between the number of up/down days versus the overall final performance it might generate. That is your underlying premise. That correlation would reinforce your optimistic advice to “Stay after May” … or not. #2 I am especially interested in the data for 2020 and 2022, the largest outliers in your small same. #3 I remember 2022 as a miserable year with large losses, but some data on correlations would help. (Yes, correlation is NOT causality, but it IS information on the probabilities of outcomes.) Chart #2 shows this data … for unspecified periods. #4 Chart #2 data is “historical” data, which normally goes from CRSP 1926-to-date data, but that does not provide the evidence we can use to compare to Chart #1 to estimate the possible relationships between Bull and Bear markets since these larger market cycles span multiple years (usually). #5 However, even with apples-to-apples data, the beginning and end dates of B/B market cycles are very important because they would provide evidence to support your premise. The old saw about “this is the exception that proves the rule” applies here because an exception is the only way to falsify (disprove) a hypothesis, i. e. prove that it is true. All the other data merely “proves” that you do not have to reject the hypothesis at some level of confidence. A p-value only measures the probability of obtaining the observed results so you can assume that the null hypothesis is true. #6 There are other issues with your light-heated attempt to encourage us to “stay the course.” I remember, in 1992, G.H.W. Bush said exactly that just before he LOST the 1992 election because, as James Carville screamed, “it’s economy stupid.”) That inflection point in history could be an omen –not necessarily proof – that in 2024, “It IS the economy, stupid” which you use as support for your hypothesis for us to “stay the course.” Please feel free to fill in the name of whomever you think should wear the “stupid” label in 2024; there are so many candidates. #7 Note: Some argue that the 1992 election was the starting point for the entrenched 50%-50% divisions we see on so many issues that began the plague of divided decision-making to this date; others place the origin it at the 2000 election. Either way, the same players are involved to this day. #8 In his 1987 Letter to Shareholders, the masterfully quotable Warren Buffett said: “If you've been in the [poker] game 30 minutes [or 5 months?] and you don't know who the patsy is, you're the patsy.” At the 5/4/2024 Woodstock for Capitalists, The Oracle indicated the was staying the course. Words to the wise from a very wise man.
You need to log in as a registered AAII user before commenting.
Create an account