

May Charts of Interest: Buybacks Are Rising
by Charles Rotblut | May 16, 2024
S&P 500 index companies have announced more than $383 billion worth of share repurchases within the last 13 weeks, according to Yahoo Finance, citing research from Deutsche Bank. This is the largest sum since 2018.
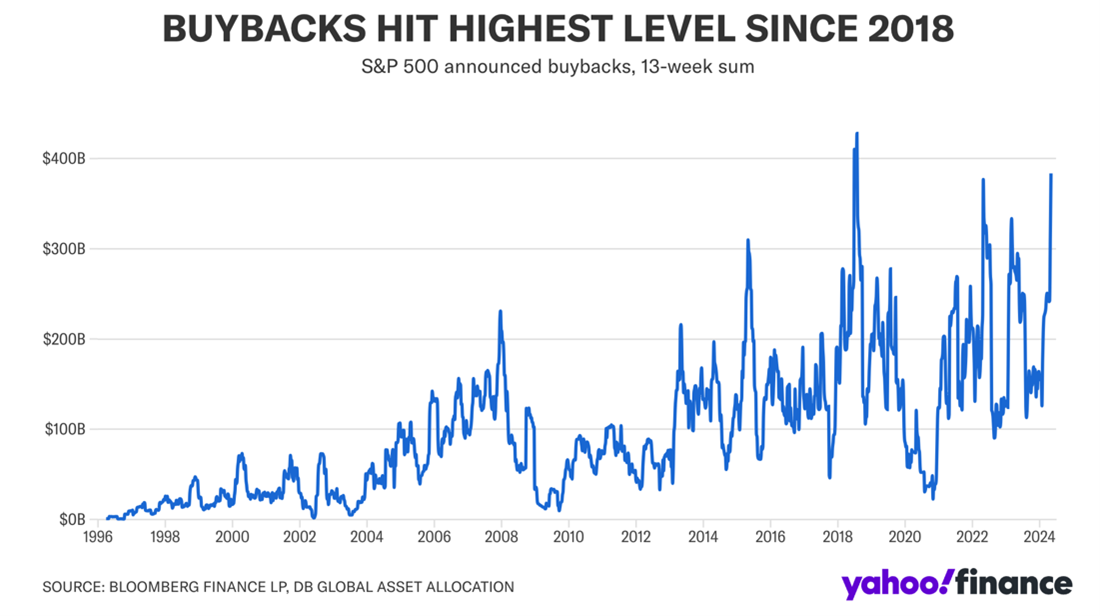
The Wall Street Journal, using data compiled by Birinyi Associates, says $181.2 billion of shares were repurchased during the first quarter of 2024. This amount is based on S&P 500 companies that have reported first-quarter 2024 results as of last Monday.
While the numbers are not apples to apples, they both point to an increase in corporations’ willingness to repurchase shares of their own stocks.
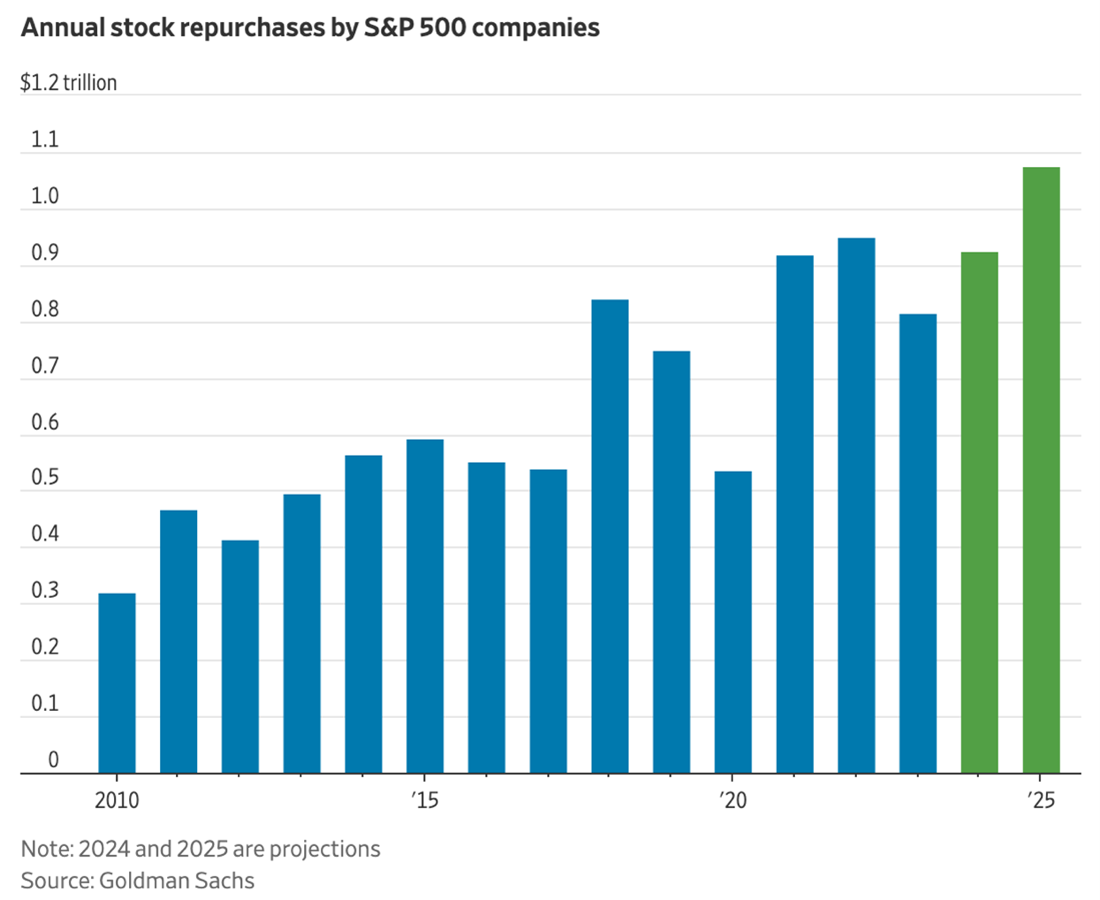
This higher level of repurchase activity is expected to continue. According to The Wall Street Journal, analysts at Goldman Sachs project that “total S&P 500 repurchases will reach $925 billion [in 2024] and $1.075 trillion in 2025.” These amounts, if achieved, equate to growth rates of 13% and 16%, respectively.
Traders Are Not Scared of the Big, Bad Bear
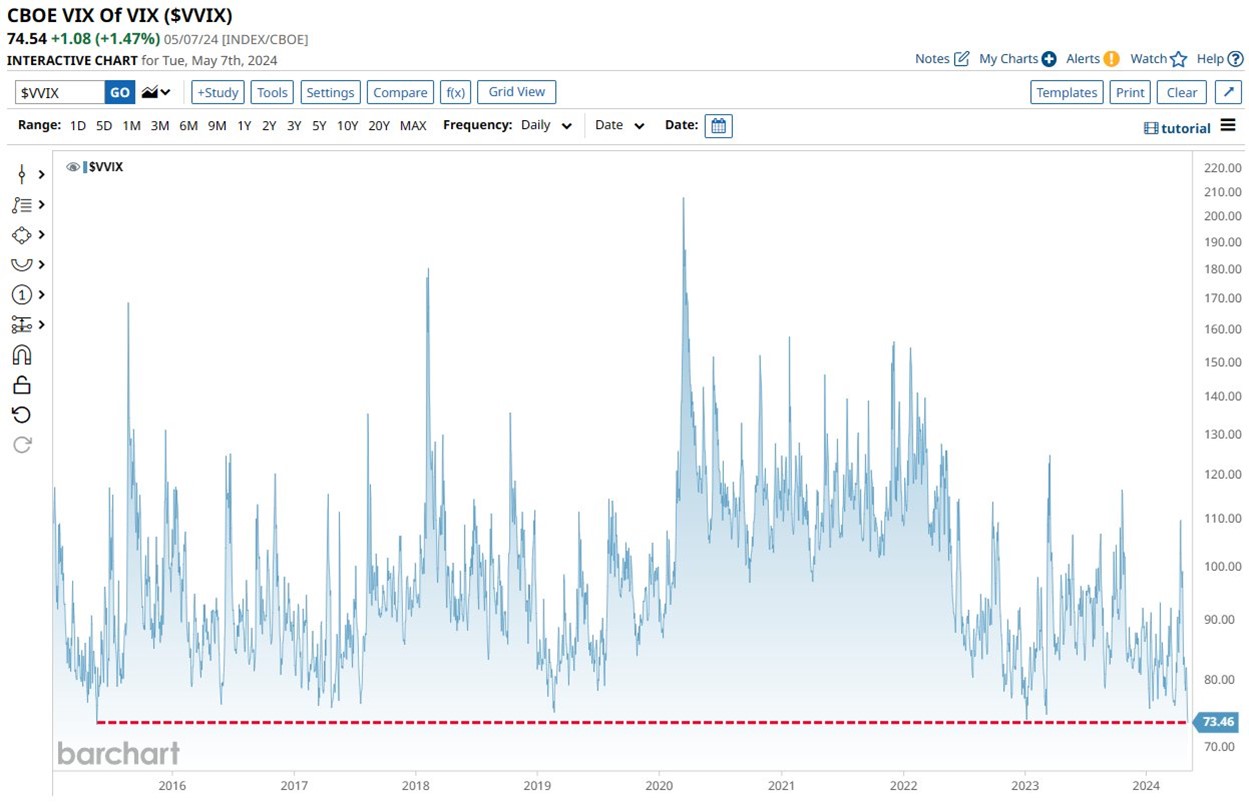
The Chicago Board Options Exchange’s (CBOE) Volatility index (VIX) is often referred to as the fear gauge. It measures the implied or expected volatility of S&P 500 options over the next 30 days. The higher the value, the more volatile traders expect the stock market to be over the short term.
Last week, traders were evidently sleeping quite well at night. Barchart observed that the CBOE VIX of VIX—an index that measures the volatility of the VIX’s price—fell to its lowest price in nine years.
Individual Investors Are Getting Wealthier
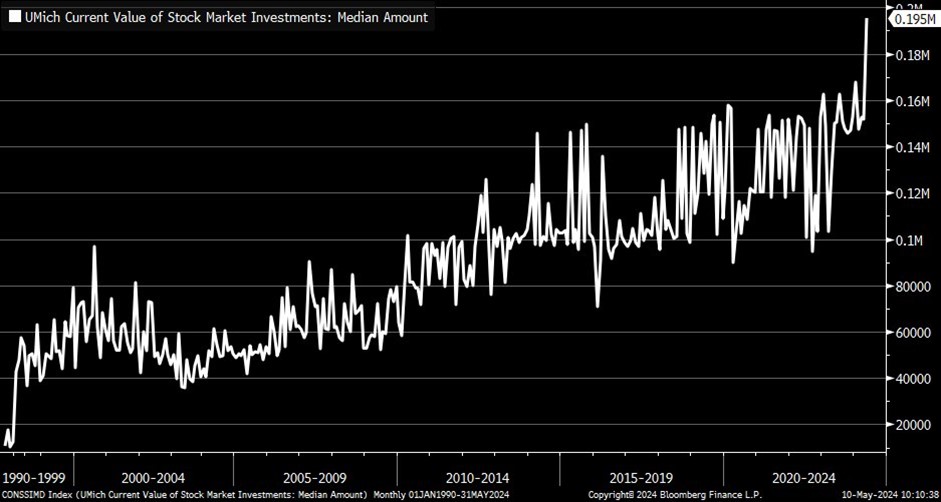
The median value of consumers’ stock market investments reached $195,000 in May. Charles Schwab senior investment strategist Kevin Gordon says this is an all-time high.
AAII members, as a group, are wealthier. Our 2024 member survey shows that the median member has a self-reported investment portfolio of $2.0 million. (This based on results from those who have renewed their membership at least once or are a life member.)
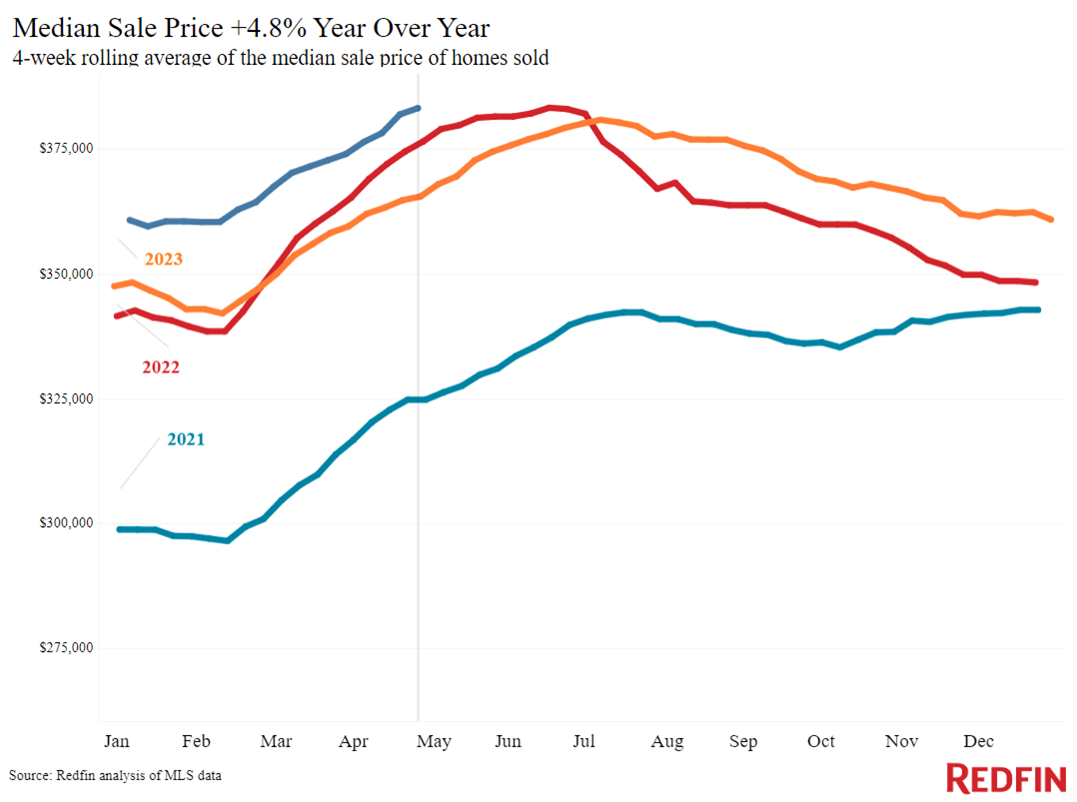
House Prices Are Up Across the Country
“For the first time in nearly 2 years, there’s no major American metro [area] where home prices are falling,” wrote Redfin data journalist Dana Anderson. Median home prices either or rose or held steady on a year-over-basis in all 50 of the most populous U.S. metro areas. This last happened in July 2022.
The lack of inventory remains a key driver. Anderson observed that “there were fewer new listings this April than any year on record except 2023 and 2020.”
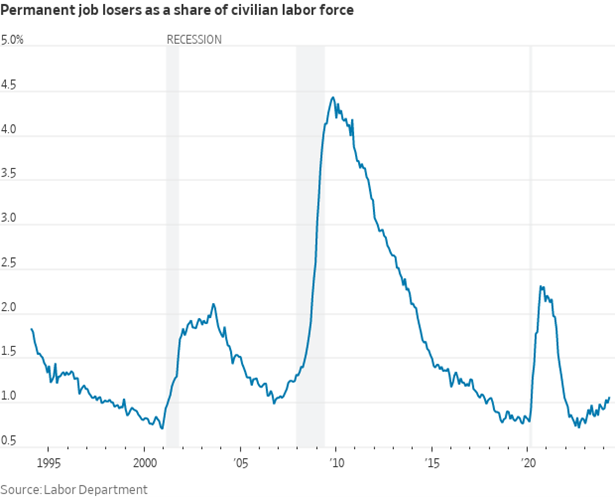
A Weak Spot in the Labor Market
One ongoing trend within the employment sector is rising permanent job losers. These are workers who are unemployed and not on temporary layoff. The percentage of such workers has been rising since September 2022, as this chart from The Wall Street Journal’s Nick Timiraos shows.
Note that the current level remains well below what we’ve seen during past recessions.
Insuring That Car Is How Much?!
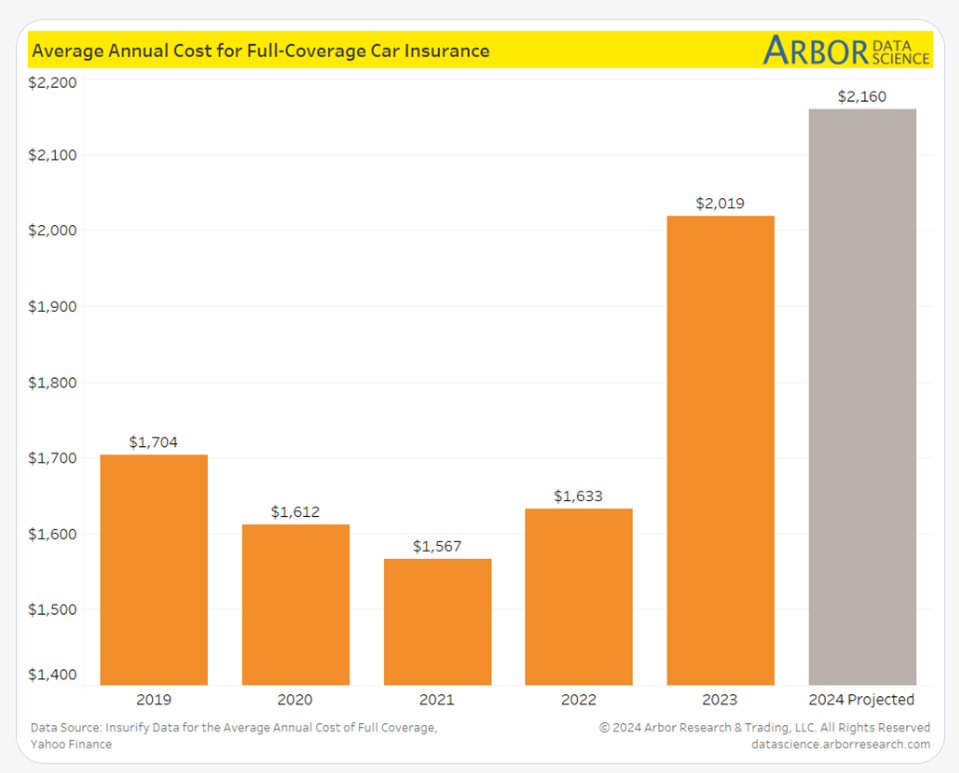
Arbor Data Science projects that the average annual cost for full-coverage car insurance will be $2,160 in 2024.
There are various factors playing into the higher premiums. New cars are more expensive. The technology inside late-model cars makes them more expensive to repair. Parts and labor are up. Climate change is also likely playing a role, especially in areas with more floods or fires.
While I thought fatalities might also play a role, government data shows that vehicle-related deaths fell in 2023. Still, keep your eyes on the road—and off the screens.

-
Stock Buybacks: Misunderstood, Misanalyzed and Misdiagnosed
The benefit or harm of a stock buyback is dependent on several factors, including how it is funded and the alternative uses for the cash. -
Measuring Market Volatility Trends With the VIX
The power of the S&P 500 Volatility Index lies more in its relative, or comparative, level than in its absolute level. -
Meeting Your Asset Allocation Needs With BlackRock Funds and ETFs
The May AAII Journal shows you how AAII’s Asset Allocation Models can be followed by choosing among funds from the BlackRock family.
AAII Sentiment Survey
Pessimism among individual investors about the short-term outlook for stocks decreased in the latest AAII Sentiment Survey. Meanwhile, optimism was unchanged and neutral sentiment increased.
Bullish sentiment, expectations that stock prices will rise over the next six months, was unchanged at 40.9%. Bullish sentiment is above its historical average of 37.5% for the 27th time in 28 weeks.
Neutral sentiment, expectations that stock prices will stay essentially unchanged over the next six months, increased 0.5 percentage points to 35.9%. Neutral sentiment is above its historical average of 31.5% for the fourth time in nine weeks.
Bearish sentiment, expectations that stock prices will fall over the next six months, decreased 0.6 percentage points to 23.3%. Bearish sentiment is below its historical average of 31.0% for the second time in five weeks.
The bull-bear spread (bullish minus bearish sentiment) increased 0.6 percentage points to 17.6%. The bull-bear spread is above its historical average of 6.5% for the second time in five weeks.
This week’s special question asked AAII members about their perception of inflation.
Here is how they responded:
- It’s slowing, but not by enough: 46.0%
- It’s still rising too quickly: 26.1%
- It’s returning to a more acceptable pace: 23.5%
- Not sure/no opinion: 4.4%
Bullish: 40.9%, up 0.0 points
Neutral: 35.9%, up 0.5 points
Bearish: 23.3%, down 0.6 points
Bullish: 37.5%
Neutral: 31.5%
Bearish: 31.0%
See more Sentiment Survey results.

May 9, 2024 Does It Make Sense for BlackRock to Add Annuities to Retirement Plans?
May 2, 2024 Reasons for Not Selling Stocks This May
April 25, 2024 The Benefits and Costs of Diversification in My 403(b)
April 18, 2024 April Charts of Interest: The S&P 500's Streak Ends

Discussion
Barry from TX posted over 2 years ago:
Charles, I suspect you “curated” these data points into a theme, but I am not certain. I see a theme in the data points indicating markets are expected to continue rising in 2024. #1 “SPX Buybacks Highest since 2018” [WSJ] means prices will rise as shares are depleted. #2 “Traders Not Scared of the Big, Bad Bear” [VIX] means traders expect markets to rise ST. #3 50% of “AAIIers have >$2M Net Wealth” (is not AUM; homes and other assets could be 25%-50% of that figure and there is ALWAYS “self-reported” inflation whenever people are asked about their wealth, except at tax time) means AAIIers are VERY heavily invested. #4 Median value of consumer stock market investments reached $195,000 (comparative data for the magnitude of the difference in #3; AAIIers median is almost 10x above the population median.) This most likely reflects the same skew as average US household income statistics that show median is a weak measure of the shape of the overall distribution of US wealth. It also could indicate important marketing opportunities for AAII. If AAII “educated” AAII multi-millionaires achieve their wealth, they should be more willing to pay higher AAII fees. This factoid could support that the PRISM process works (there are Community threads that challenge this. And I question the demographics; younger and new members may be underrepresented in this sample. #5 “House Prices Are Up Across the Country” (data supporting analysis in #3). #5 A Weak Spot in the Labor Market” 2024 data below during past recessions indicates a stronger economy which helps markets. “#6 Insuring That Car Is How Much?!” (Besides the 5 factors you identified, a lurking factor here may be all the expensive cars all those AAII multi-millionaires are driving. #7 B-B Spread @17.6% is about 3x wider than HA @6.5% and there is very low movement (0.5%-0.6% ) this week. Are the AAII multi-millionaires all in on a rally when a famous investor advises “be fearful when others are greedy.” Charles, thanks for the gedankenexperiment opportunity.
John L from NJ posted over 2 years ago:
Inflation: Companies have more money for buyback, investors are wealthier, house prices are higher, and insurance is more expensive at least in nominal dollars. Throw in the unrelated VIX and minor uptick in permanent job losers and call it breaking news. None of this tells investors anything about the future. But it is interesting.
Barry from TX posted over 2 years ago:
Fidelity reported today 5/24/24 that "Average retirement account balances, meanwhile, hit their highest level since the end of 2021, rising to $125,900 for 401(k)s and $127,745 for IRAs." Does this indicate that there are not many AAII multi-millionaires invested at FIFO? ....or ... (see above.)
Michael CPA-retired from CA posted over 2 years ago:
Apple Inc.’s proposed record $110 billion buyback will reduce shares outstanding by approximately 4%. The remaining – and continuing – 96% of stockholders at the time of the buyback will then be the 100% owners of a minimal, or a deficit, Balance Sheet Equity. After the buyback the Balance Sheet Equity WILL ONLY BE POSITIVE as of the next quarter-end if, for that quarter, the cumulative net profits exceed $36 billion plus any dividends paid – per my calculations [since Balance Sheet Equity as of the Quarter ending 3/31/2024 is only $74,194,000 thousands (i.e., approx. $74.2 billion)].
Michael CPA-retired from CA posted over 2 years ago:
In my opinion Apple Inc.’s buyback represents a failure of management’s fiduciary duty to the current 96% of shareholders that won’t be participating in the buyback. Apple Inc.’s proposed record $110 billion buyback means its Cash, the most “real” of assets on its Balance Sheet, will decrease by that amount. Before the buyback that $110 billion of Cash is owned by all the shareholders and represents approximately $4.84 per share. Assuming $181.92 is paid per share in the buyback, $177.08 per share is Cash that was really owned by the continuing, non-participating in the buyback, shareholders. That $177.08 per share will total $107+ billion (previously owned by the continuing shareholders, not participating in the buyback) which is being paid to management for shares they received from stock option compensation, as well as to those large stockholders, chosen at managements sole discretion, who are allowed to participate in the buyback. None of that decrease in Cash will have paid down any Debt, nor interest on the Debt, nor will it have paid any costs of operations or purchased any assets, and very importantly it will no longer be available in reserve in case of an unforeseeable need.
Michael CPA-retired from CA posted over 2 years ago:
Apple Inc.’s management’s proposed $110 billion stock buyback has failed their fiduciary duty to the 96% of shareholders that won’t be participating in the buyback. This proposed transaction is an example of the error associated with any buyback where the Price paid per share is greater than the Book-value Equity per share (i.e., a Price/Book Ratio of greater than 1/1). This matter is relevant to almost every S&P 500 company’s stock buyback, because the S&P 500’s average Price/Book Ratio is approximately 4/1.
You need to log in as a registered AAII user before commenting.
Create an account