

September Charts of Interest: Rate Cuts, Plus a 3,821% Investment Return
by Charles Rotblut | September 18, 2025
Given yesterday’s interest rate cut announcement by the Federal Reserve, I start this month’s charts of interest by looking at where interest rates could be headed. I then move on to the stock market’s summer rally and portfolio allocations, before ending with the hottest investment over the past few years. (Hint: It’s likely not at all what you are thinking.)
As a reminder, the charts of interest highlights charts and tables I’ve come across that have not made their way into other AAII commentaries but provide insights about the financial markets and the economy.
The Dot Plot Calls for Lower Rates
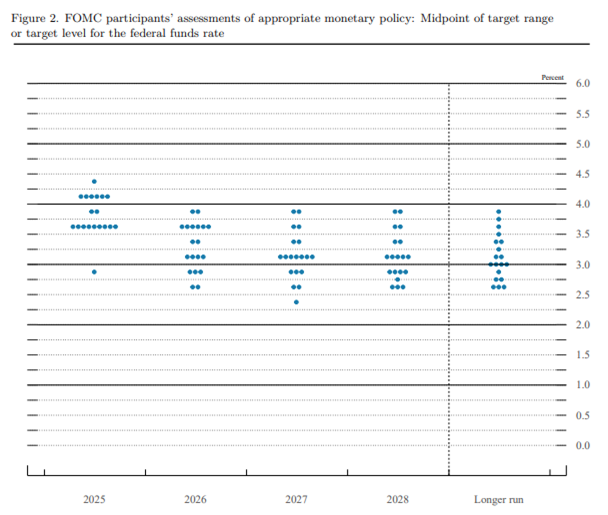
The so-called dot plot shows where Federal Open Market Committee (FOMC) participants project interest rates to be over the next few years. Each dot represents the forecast of a committee member for a given year. The dot plot is updated quarterly.
FOMC members currently expect to make one to two additional quarter-point interest rate cuts this year following yesterday’s 0.25% cut. The lone 2025 dot below 3.0% likely belongs to recent appointee Stephen Miran.
Further interest rate cuts are projected for next year. These forecasts are very much subject to change.
Source: Federal Reserve.
The Discount Rate Was Lowered Too
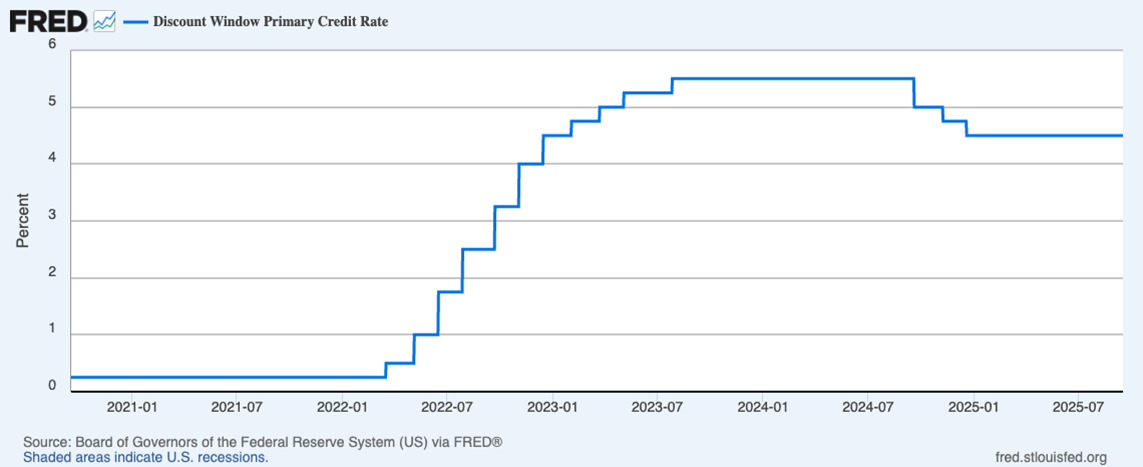
Less noticed was a decision by Fed governors to lower the discount rate from 4.50% to 4.25%. The discount rate is the interest charged to banks to borrow money from the central bank. Reductions in this rate further signal accommodative monetary policy. (The below chart from the St. Louis Federal Reserve’s FRED database had yet to be updated as of this morning.)
An Infrequent Winning Streak for the S&P 500
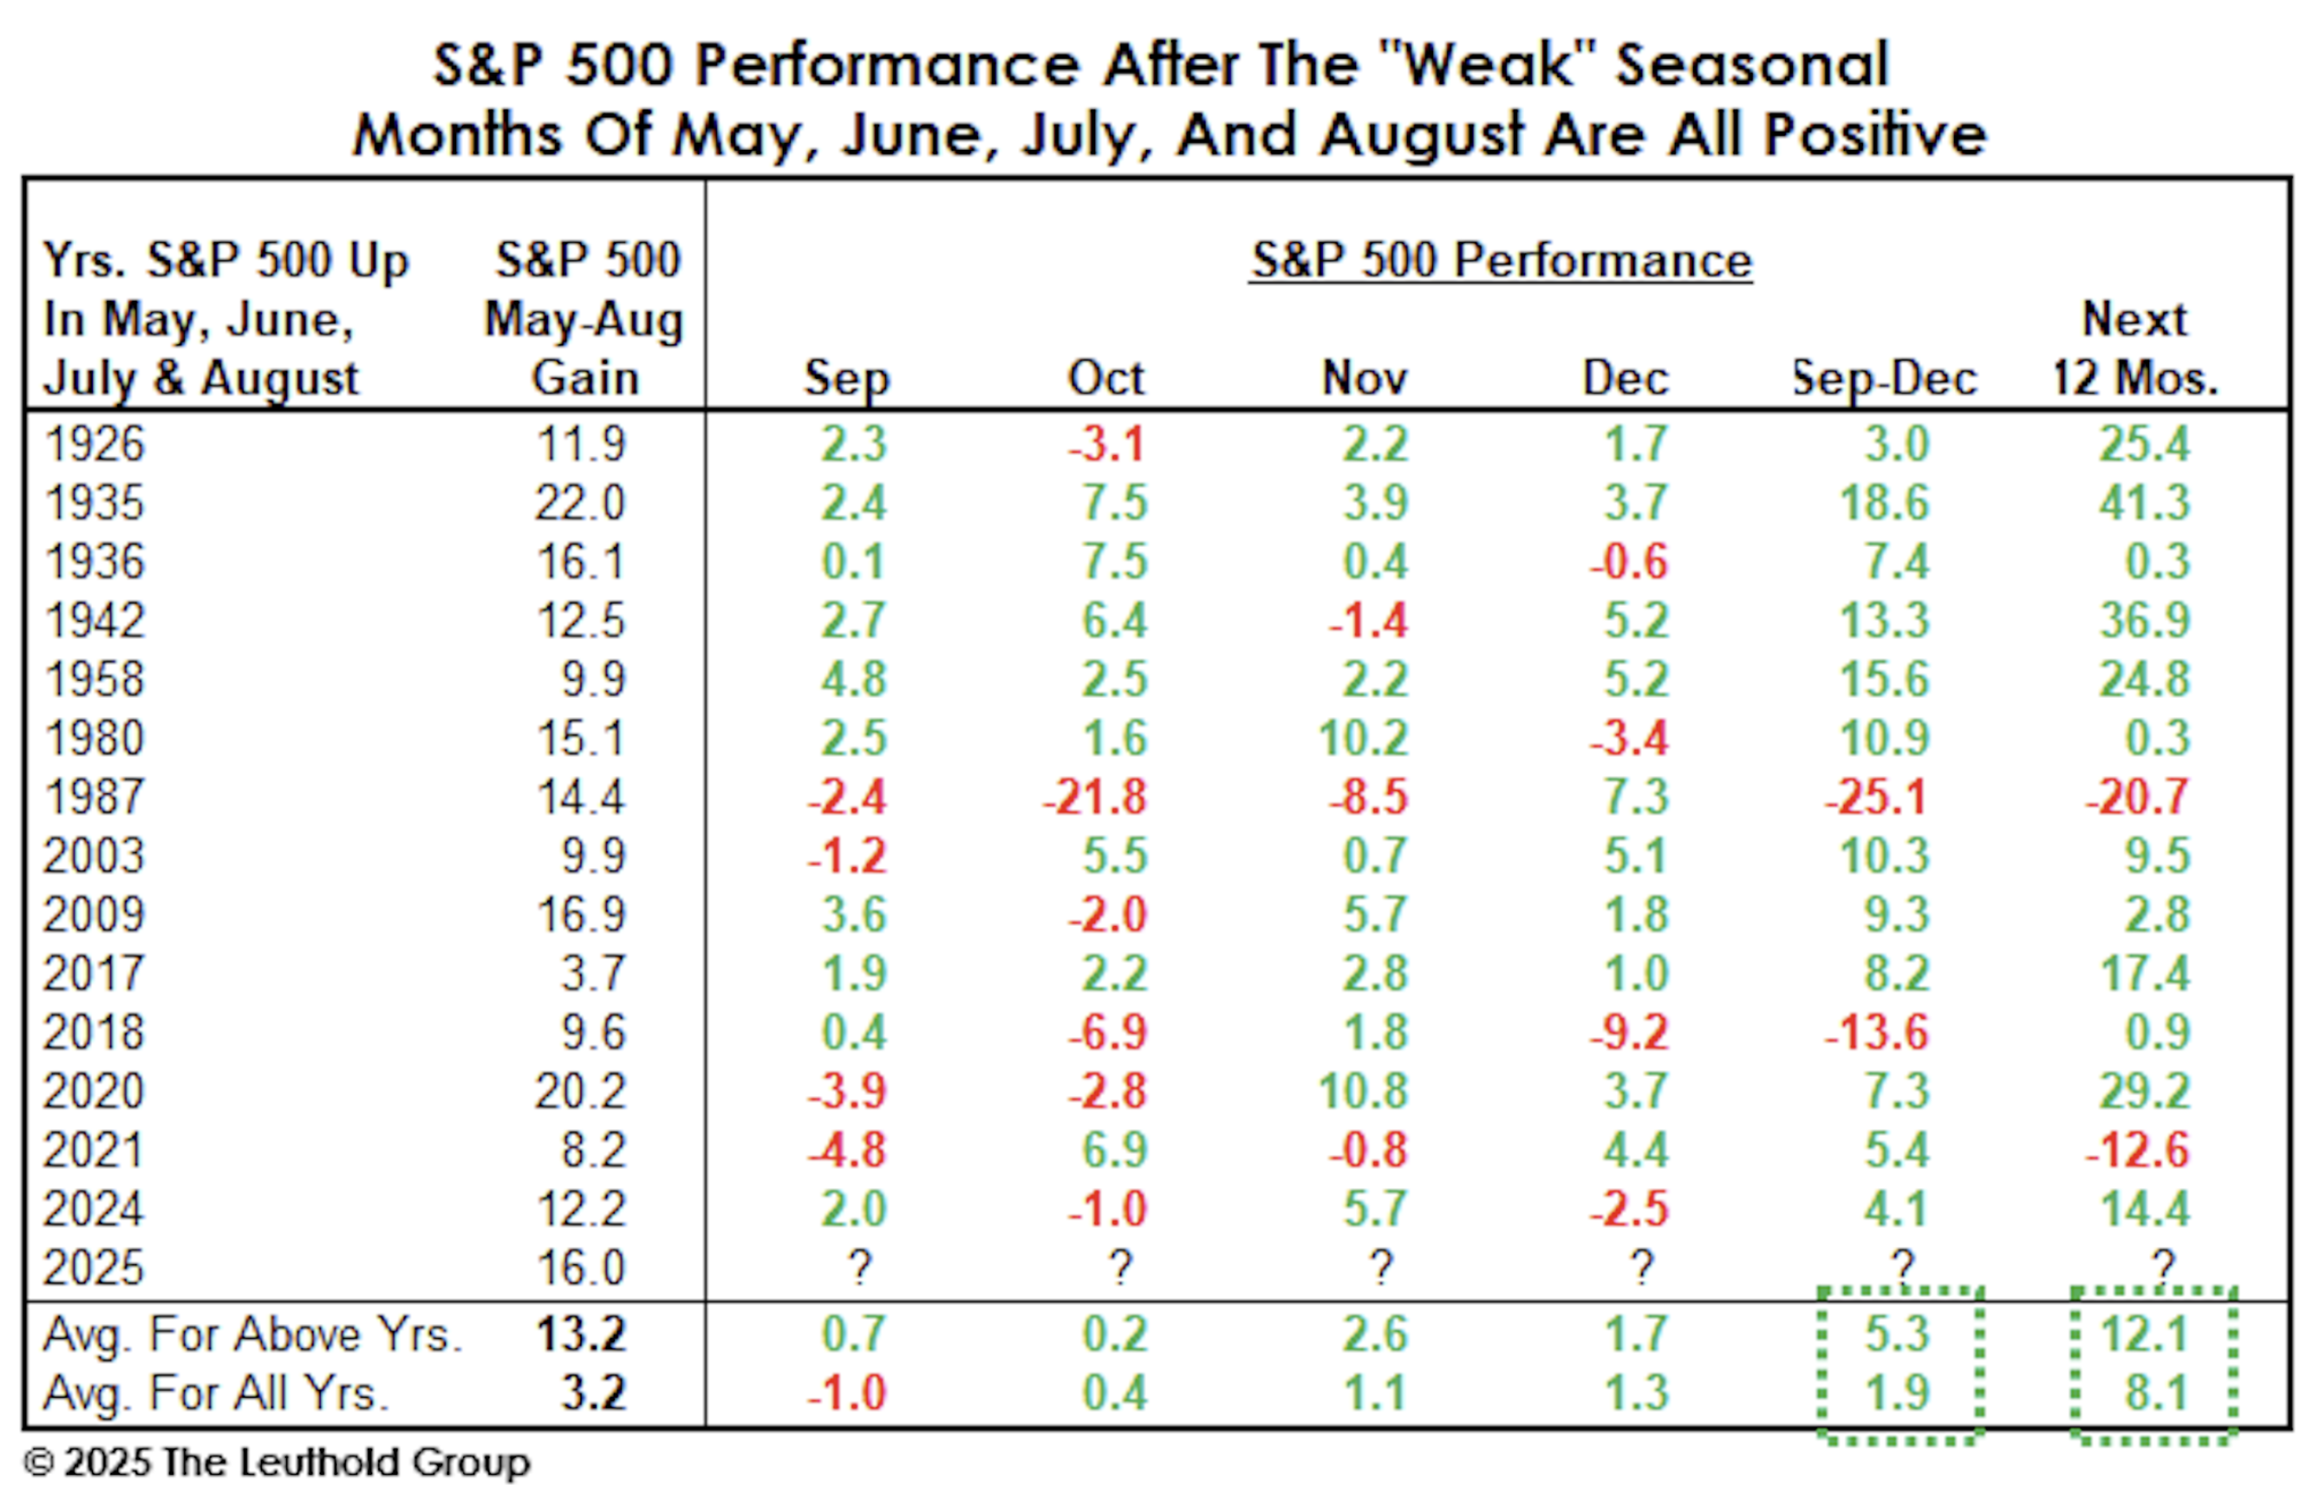
The S&P 500 index realized consecutive gains in May, June, July and August. According to Leuthold Group chief investment officer Doug Ramsey, this summer’s winning streak has only happened 14 other times over past 100 years. The winning streak is also notable because May through October has historically been the weakest six-month period for the stock market.
“Since 1926, when all four of these historically weak months have been positive, S&P 500 average performance from September through December has been +5.3%—a figure marred by both the 1987 crash and the late-2018 market falloff,” stated Ramsey.
The sample size is small, and history is never guaranteed to repeat. Nonetheless, it is nice to have the odds in our favor.
Institutional Investor Equity Allocations at a 28-Year High
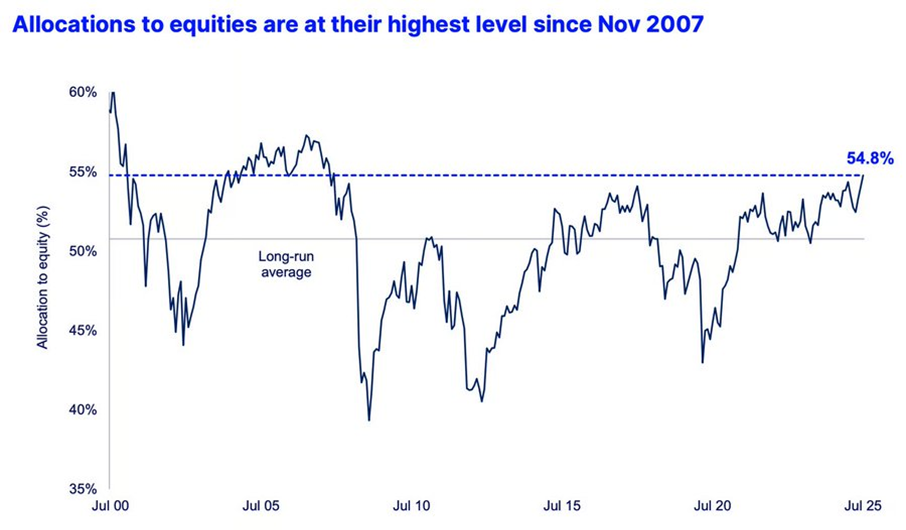
Institutional investors’ exposure to equities is at its highest level since November 2007, according to State Street.
Record high prices for U.S. stock markets have boosted the value of equities, while the lack of a meaningful pullback in yields has capped returns for bonds. Both of these factors plus institutional investor preferences play a role in current allocations.
Source: State Street Markets and Daily Chartbook.
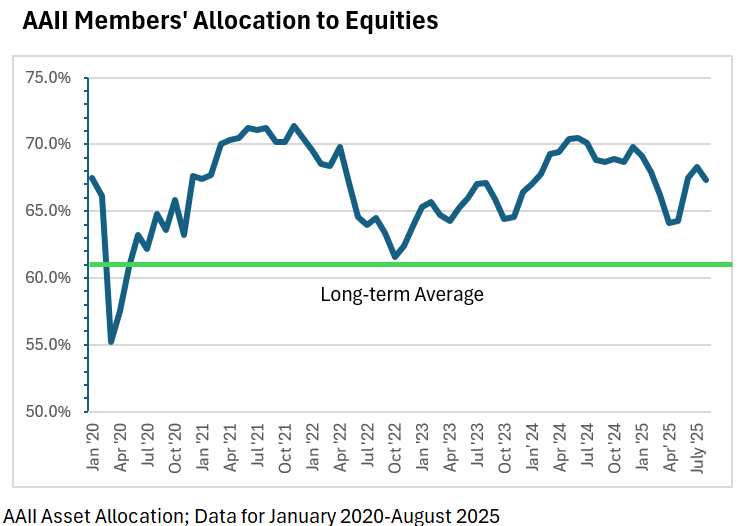
I’ll add that equity exposure among AAII members continues to stay above the long-term average of 62.0% in the AAII Asset Allocation Survey. Stock and stock fund allocations were 67.3% last month.
Covered Call Strategies Lag in Good Market Conditions
Exchange-traded funds (ETFs) using options strategies have been growing in popularity. Among the options strategies used are covered calls. Covered call strategies involve selling (“writing”) call options on stocks held in a portfolio. The goal for the call writer (seller) is to have the option contract expire unexercised. This allows them to realize extra income without selling the underlying stock.
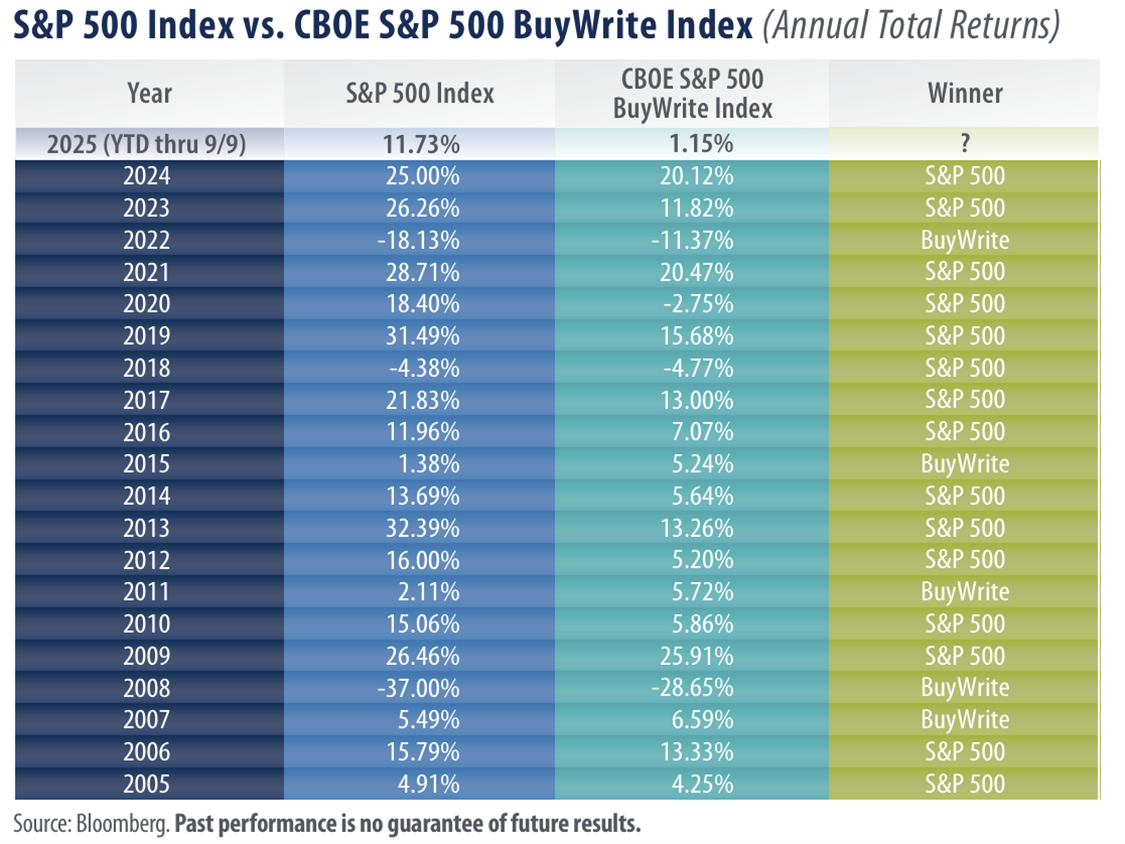
The return data shows that these strategies have not been as attractive as their proponents may suggest. Return data published by Robert Carey and Peter Leonteos of First Trust shows the S&P 500 outperforming the CBOE S&P 500 BuyWrite index during 15 out of the last 20 years.
Covered call strategies have historically lagged when the S&P 500’s returns have been above 10% in a calendar year. This is likely because covered call strategies limit upside returns. The long-term average return for large-cap stocks is 12.3%.
Covered call strategies do outperform “when the stock market posts negative returns, or when returns range from 0%–10%,” explained Carey and Leonteos. Good luck trying to predict those years in advance.
The Hottest Investment Is …
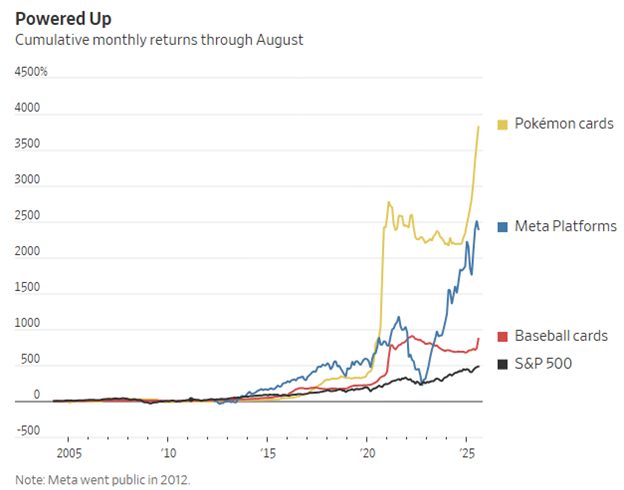
Pokémon cards have realized a 3,821% monthly cumulative return since 2004, according to The Wall Street Journal’s report based on data from analytics firm Card Ladder. Cards of the fantasy game’s characters saw their prices jump during the coronavirus pandemic. Prices rose further after an influencer purchased a card for $5.3 million in 2022.
As is the case with baseball and other sports-related cards, rarity and condition matter. More importantly, demand can change faster than a Pokémon can use one of their special powers.
Source: The Wall Street Journal, Card Ladder and FactSet.

-
AAII Asset Allocation Survey
Members are polled monthly on their current holdings among the five asset categories. A downloadable spreadsheet of historical results goes back to 1987. -
Using a Covered Call Strategy to Generate Income
A covered call strategy offers investors the chance to collect dividends, generate premium income, benefit from some price appreciation in bull markets and mitigate losses in a bear market. -
How Financial Statements Drive Stock Valuation Ratios
Find out how understanding the ways financial statements influence valuation measures helps you spot both positive and negative changes, in the September 2025 AAII Journal.
AAII Sentiment Survey
Optimism among individual investors about the short-term outlook for stocks increased in the latest AAII Sentiment Survey. Meanwhile, neutral sentiment and pessimism decreased.
Bullish sentiment, expectations that stock prices will rise over the next six months, increased 13.6 percentage points to 41.7%. Bullish sentiment is above its historical average of 37.5% for the first time in seven weeks.
Neutral sentiment, expectations that stock prices will stay essentially unchanged over the next six months, decreased 6.5 percentage points to 16.0%. Neutral sentiment is unusually low and is below its historical average of 31.5% for the 61st time in 63 weeks. This is the lowest neutral sentiment reading in five months, since April 10, 2025, when it was 12.5%. Today’s neutral sentiment reading ranks among the 50th lowest in the survey’s history.
Bearish sentiment, expectations that stock prices will fall over the next six months, decreased 7.1 percentage points to 42.4%. Bearish sentiment is unusually high and is above its historical average of 31.0% for the 42nd time in 44 weeks.
The bull-bear spread (bullish minus bearish sentiment) increased 20.8 percentage points to –0.7%. The bull-bear spread is below its historical average of 6.5% for the 31st time in 33 weeks.
This week’s special question asked AAII members where they would put the odds of a recession occurring before the end of this year.
Here is how they responded:
- Highly likely: 4.2%
- A higher-than-typical chance: 26.9%
- Not more or less likely than I would normally expect: 26.9%
- Unlikely: 39.6%
- Not sure: 2.3%
Bullish: 41.7%, up 13.6 points
Neutral: 16.0%, down 6.5 points
Bearish: 42.4%, down 7.1 points
Bullish: 37.5%
Neutral: 31.5%
Bearish: 31.0%
See more Sentiment Survey results.

September 11, 2025 Muni Bond Funds' Additional Advantage
September 4, 2025 Beware of the Popularity Trap for ETFs
August 28, 2025 History Cautions That Keurig Dr Pepper Spin-Off Returns Could Fizzle
August 21, 2025 August Charts of Interest: Valuations at Dot-Com Bubble Levels

Discussion
Dennis from CA posted about 1 year ago:
"odds in our favor". "Our". That is, odds against for those who'd like to get a better deal per dollar of earnings/dividends.
Barry from TX posted about 1 year ago:
Charles, #1 Please tell Wayne that his 09/20/25 analyses of the 12 AAII Sentiment indicators and the related Market dynamics indicators helped me understand the comparative historical probabilities that might impact my current portfolio position during this time of extreme "pattern convergence." #2 This divergence makes sense. The tide is turning; near-term corporate EPS yields are almost a full 1% LOWER than the same period bond/UST yields. #3 The 23rd Psalm would seem to provide appropriate countenance when a household is divided against itself like the current AAII sentiment. #4 I hope the two AAII investor camps are appropriately diversified. If so, BOTH strategies could win, although real returns may be lower due to market inflation. #5 A very similar 2020-2022 market ended with mixed results — briefly up 7% over 3 months (EOY this time), then essentially flat the following year. #6 The Fed had its thumb on the scales then, too. This time it's the unemployment mandate.
You need to log in as a registered AAII user before commenting.
Create an account