

September Charts of Interest: Some Stocks Stay Expensive
by Charles Rotblut | September 21, 2023
Featured Tickers: MSFT
MSFT
Raymond Rondeau will be taking the stage at the Money Show in Orlando, Florida, on October 31, 2023. Join us and other esteemed AAII experts as we delve into crucial investing topics! His presentation, “Wealth-Building Strategies,” promises a full hour of actionable insights for investors, where he covers trading and investment strategies. Rondeau will also highlight a unique mutual fund/ETF strategy that outperforms the S&P 500 index with just two transactions per year and half the risk. Click here for more information.
I tend to write my charts of interest commentary over the course of a month as various charts and tables come to my attention. Often, the theme becomes apparent as I do this. Such was the case this month as investment firm WisdomTree examined what has happened to very highly valued stocks.
Stocks with the highest price-to-sales (P/S) ratios return, on average, –2% annually over the next five years. However, some managed to buck this trend. Here are those winners and their sales growth:
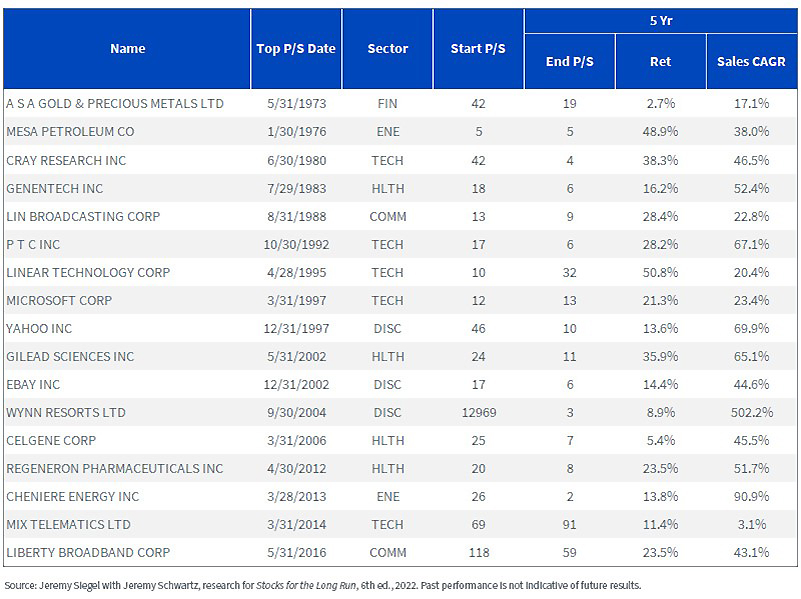
But it’s not just strong sales growth that matters. WisdomTree says that the median sales growth for the winning companies “is almost 50% annually!” This high rate of sales growth is very difficult to maintain, especially as the absolute dollar amounts to sustain it grow larger.
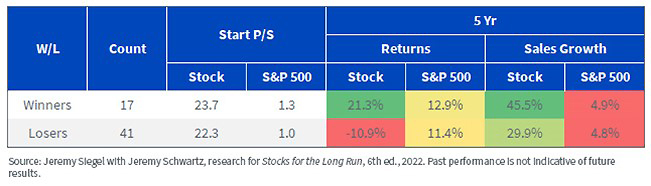
Quoting from the report, “When we look at [the second table], with the aggregated statistics on the sales growth for winners and losers, it’s clear that just growing sales faster than the market is not enough. Even the losing companies grew their sales more than six times faster than the market and still had huge negative returns. Median sales growth for the winning companies is almost 50% annually!
“The sales growth that a company must sustain to continue to stay competitive and justify its high multiples doesn’t become easier with longer horizons either … For every surviving company that also beat the S&P 500 over the next five years, there were 2.4 that underperformed.”
It’s Hard to Stay on Top
AC/DC sang about it being a long way to the top. A sequel song would have been about the difficulty of staying at the top.
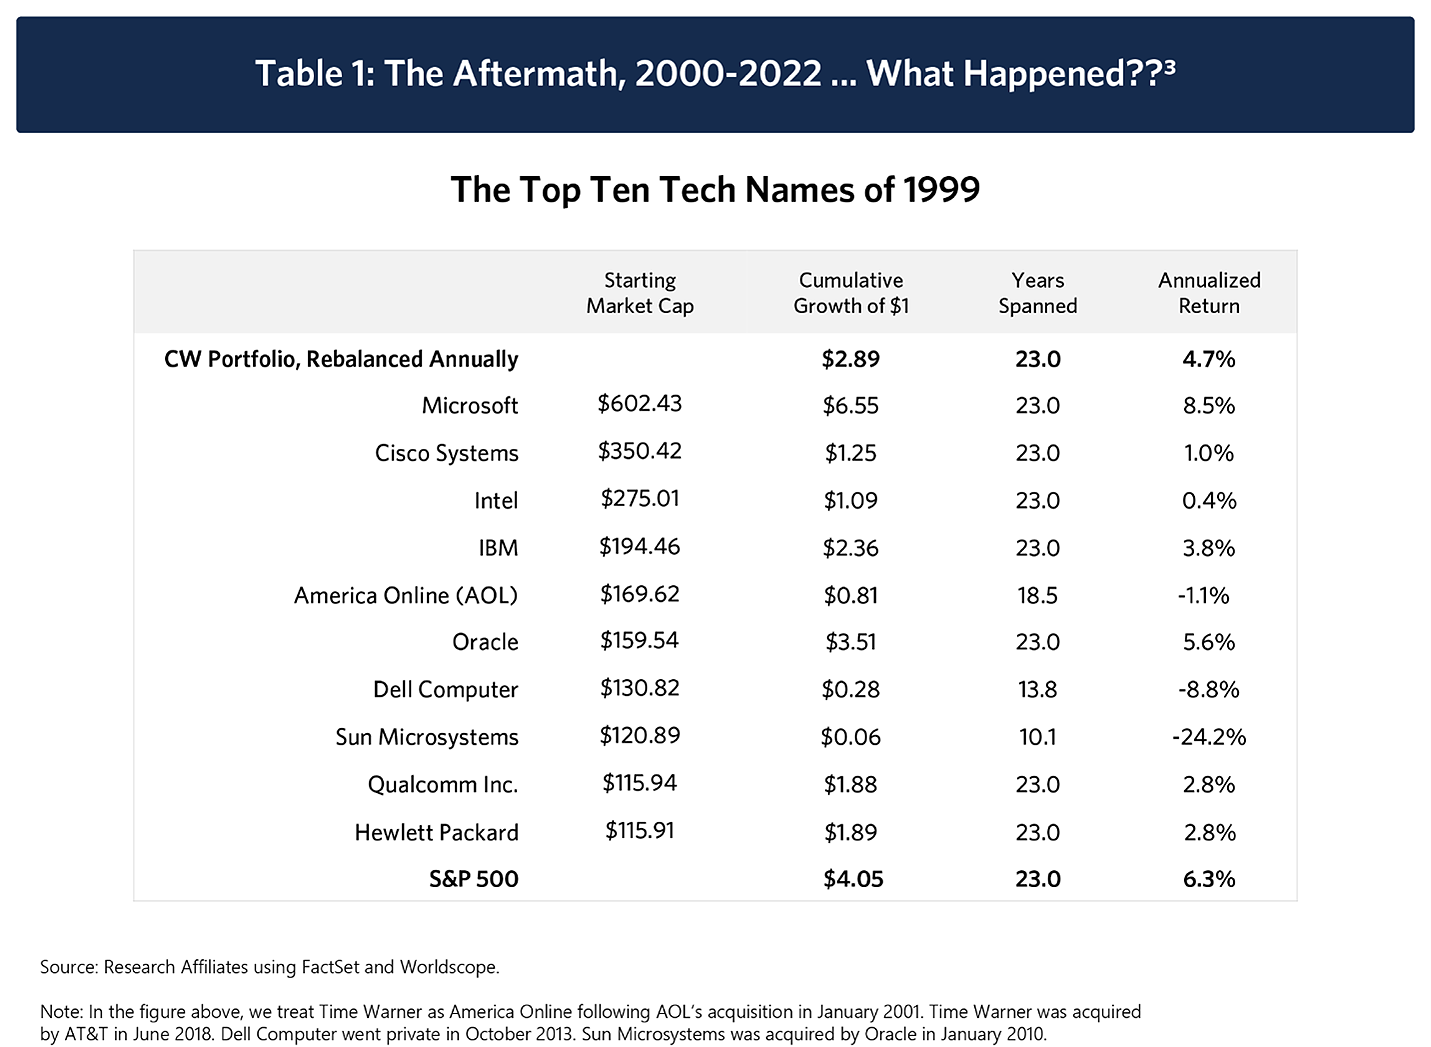
Research Affiliates crunched the numbers on what happened to the 10 most valuable technology stocks in the world at the peak of the dot-com bubble. None of them outperformed the S&P 500 index by the peak of the next bull market in 2007. Just one, Microsoft Corp.  (MSFT), outperformed the S&P 500 over the 23-year period ending in December 2022.
Tightening the Belt on Share Repurchase Plans
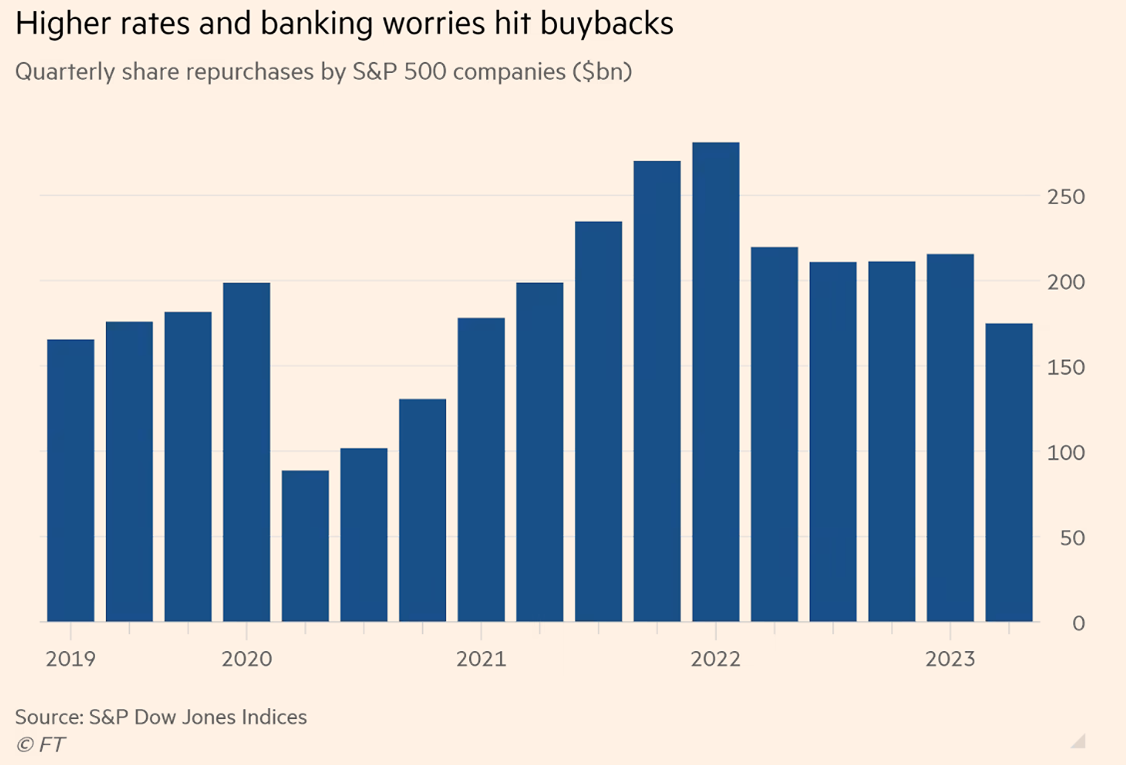
“[S&P 500 second-quarter 2023] buybacks decline 18.8%, as sector expenditures shift again; buyback tax reduced operating earnings by 0.34%” tweeted S&P Dow Jones Indices senior index analyst Howard Silverblatt last week. Preliminary numbers show share repurchases totaling $174.92 billion last quarter. If this number holds, it would be the smallest spending on buybacks since the fourth quarter of 2020 ($130.59 billion).
In commenting on the drop, The Financial Times wrote, “Companies are now facing a combination of new investment demands and higher borrowing costs, making buybacks less of a priority.”
Corporate Executive Chatter
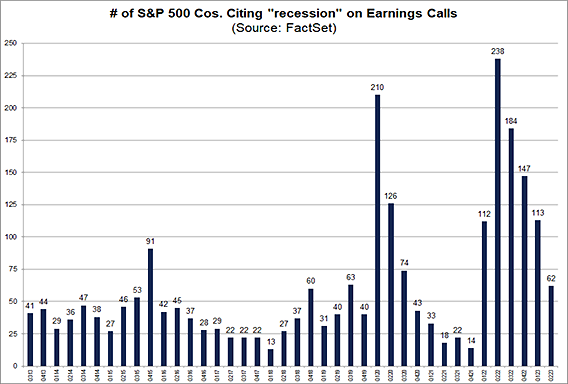
Fears of an economic hard landing appear to be subsiding among corporate executives. FactSet found that just 62 companies mentioned “recession” during their second-quarter 2023 conference calls.
“After peaking in [second-quarter] 2022, the number of S&P 500 companies citing ‘recession’ on earnings calls has declined for four straight quarters ... In fact, this quarter will mark the lowest number of S&P 500 companies citing ‘recession’ on earnings calls for a quarter since [fourth-quarter] 2021 (14),” observed senior earnings analyst John Butters.
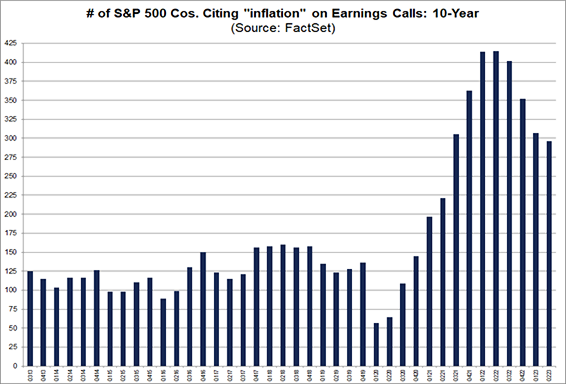
Furthermore, just under 60% of all S&P 500 companies mentioned “inflation” during their second-quarter earnings conference calls. At 296, FactSet says, “This is the lowest number of S&P 500 companies citing ‘inflation’ on earnings calls going back to [second-quarter] 2021 (221).” Even though inflation remains high, this is a positive trend.
(The x-axis on this chart could be much clearer. Unfortunately, this is how it was posted by FactSet.)
What’s the Fed Going to Do in November?
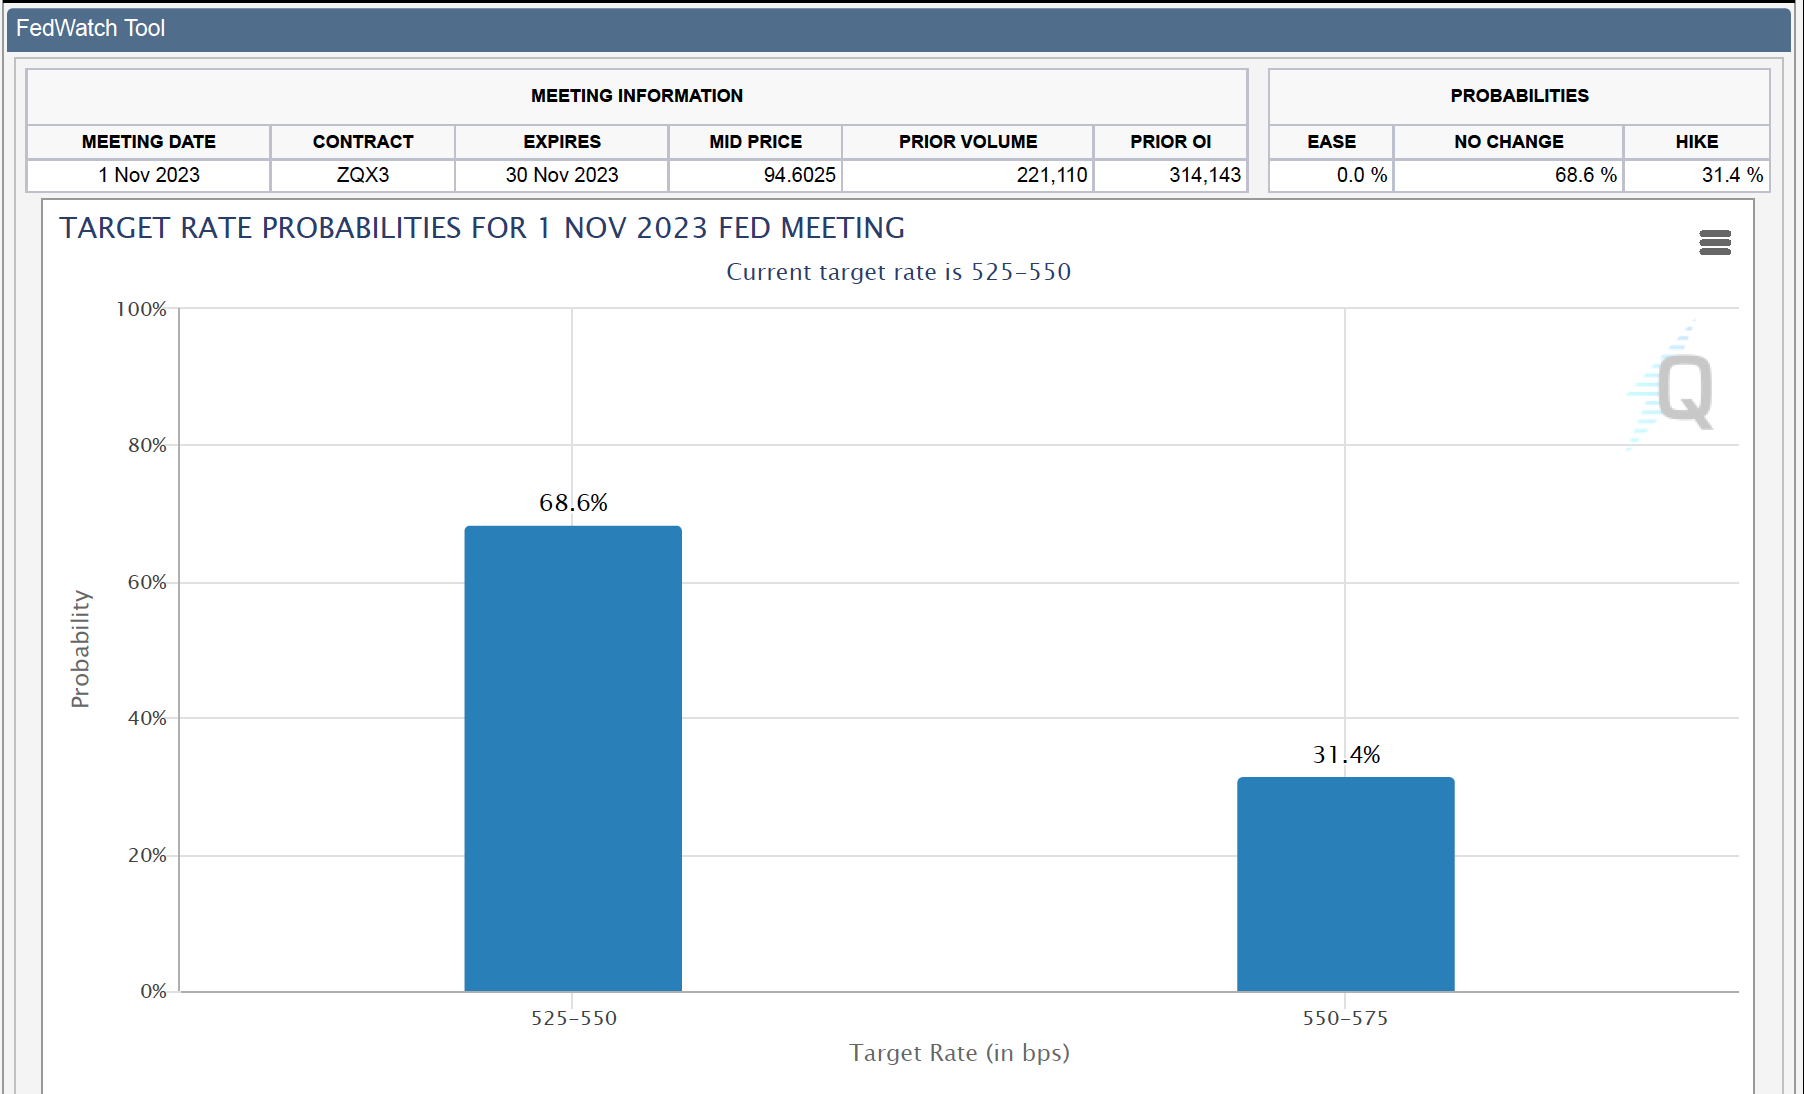
The futures markets are nearly certain that the Federal Open Market Committee (FOMC) will keep interest rates unchanged at its next meeting. November is a different story. Traders are currently pricing in nearly a one-in-three chance of another quarter-point rate hike being announced then. Federal Reserve chairman Jerome Powell said that he’s data-dependent, so we’ll have to see what the data says.
Government Shutdowns Have Had Little Effect on the Stock Market
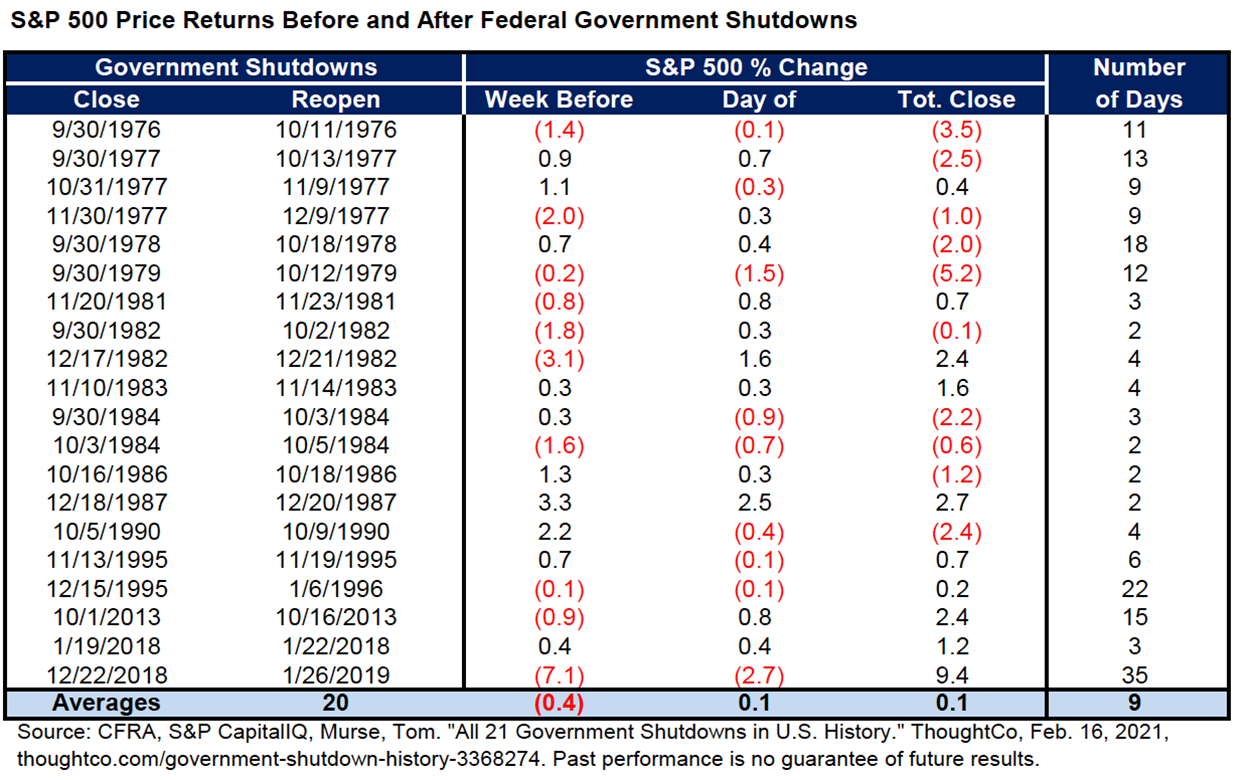
I can’t predict whether U.S. Congress will pass a short-term spending bill or cause the government to shut down (though as of this afternoon, it seems like we are headed for the latter). What I can do is share data from CFRA Research’s chief investment strategist Sam Stovall about how the stock market has reacted to previous shutdowns. As you can see below, the S&P 500 has barely budged on average.
It’s Not Investing, It’s Gambling
Two weeks ago, Bally’s opened Chicago’s first casino. The casino’s temporary location is three blocks away from the AAII office. (A permanent home for the casino is being built.)
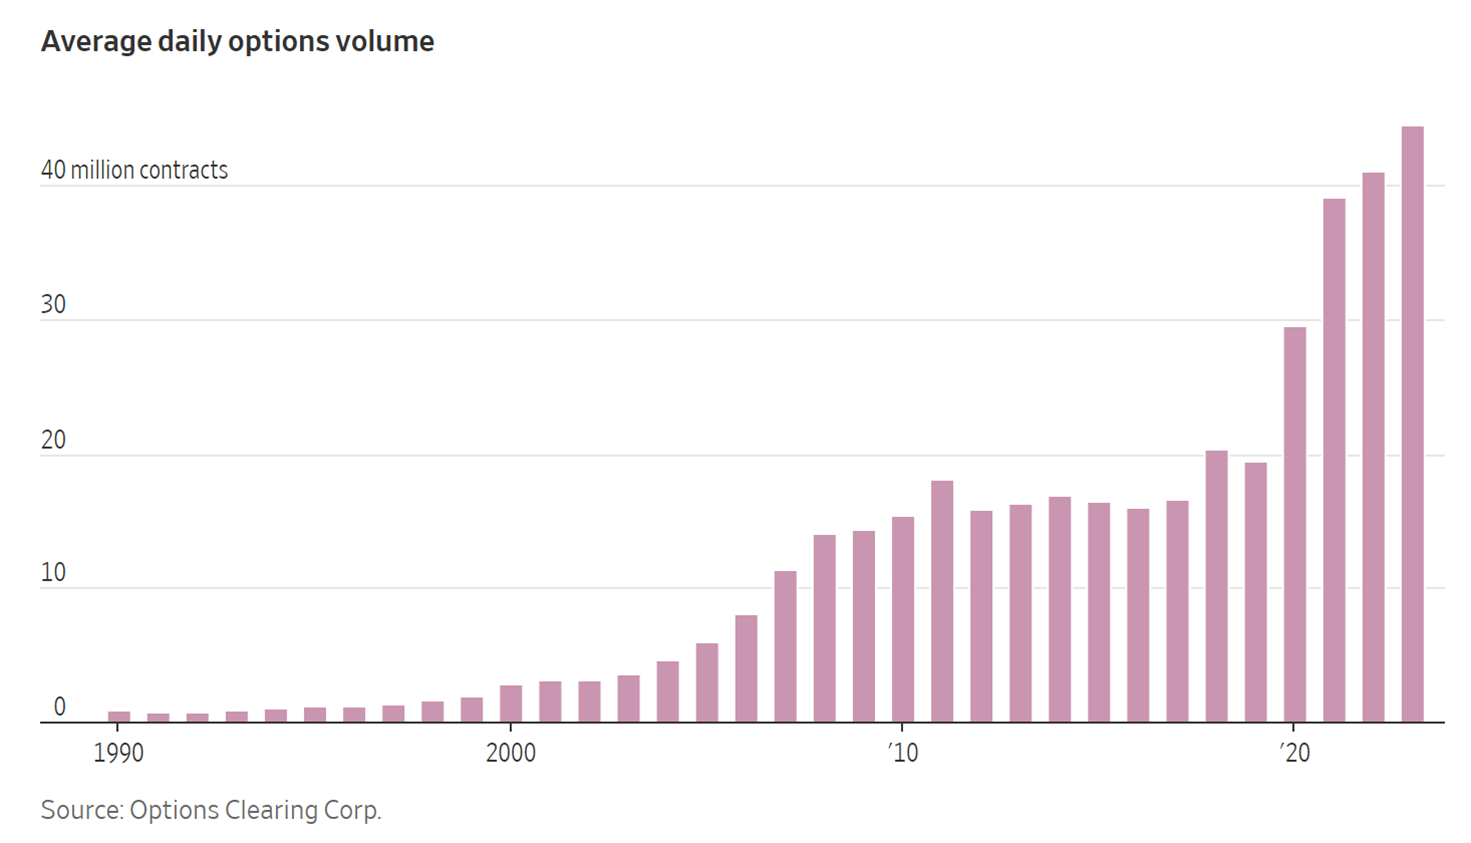
I mention this because I like my odds better at the slot machines than I do speculating on shorter-dated options—those that expire in five days or less. Citing data from the Chicago Board Options Exchange (CBOE), The Wall Street Journal recently wrote, “For popular one-day options tied to the broad S&P 500 index, individual investors made up around one-third of all trades.” Shorter-dated options, and one-day options in particular, have a high probability of expiring worthless or at least incurring a substantial loss.

-
A Top-Line Approach: The Price-to-Sales Ratio Screen
Price-to-sales ratios came into their own during the dot-com era, when earnings-based valuation models proved useless. Price-to-sales ratios continue to be a useful stock selection methodology. -
Stock Buybacks: Misunderstood, Misanalyzed and Misdiagnosed
The benefit or harm of a stock buyback is dependent on several factors, including how it is funded and the alternative uses for the cash. -
Using Fidelity Funds to Fill Your Asset Allocation Needs
Even if you are limited to choosing among Fidelity funds, you can still build a portfolio based on one of AAII’s allocation models. -
Stocks With the Largest Change in Their Earnings Estimates
Even slight changes in expectations of future earnings or the earnings growth rate can translate into a significant and lasting impact on stock prices. -
Using a Portfolio Tracker to Follow Your Current and Potential Investments
Watchlists allow you to keep tabs on the securities you own and those you are interested in. How to use AAII’s My Portfolio to follow stocks, funds and ETFs.
Members are looking for your input. Can you help with this question from the Mutual Funds & ETFs Community?
“Given a recent study suggesting a star fund manager’s past success doesn’t predict future performance after switching firms, are there star managers you follow? Who are they and why are they worth following?”
Tap the button and then choose the Join the Community button on the right to answer this question in the AAII Community
Answer This Question in the AAII Community »
AAII Sentiment Survey
The percentage of individual investors describing their short-term outlook on stocks as bullish is at a 16-week low. The latest AAII Sentiment Survey also shows bearish sentiment rebounding above its historical average.
Bullish sentiment, expectations that stock prices will rise over the next six months, fell 3.1 percentage points to 31.3%. Optimism was last lower on June 1, 2023 (29.1%). This week’s drop keeps bullish sentiment below its historical average of 37.5% for the fifth time in six weeks.
Neutral sentiment, expectations that stock prices will stay essentially unchanged over the next six months, pulled back by 2.3 percentage points to 34.1%. Neutral sentiment is above its historical average of 31.5% for the fifth time in six weeks.
Bearish sentiment, expectations that stock prices will fall over the next six months, rose 5.4 percentage points to 34.6%. Pessimism is above its historical average of 31.0% for the third time in five weeks.
The bull-bear spread (bullish minus bearish sentiment) fell 8.5 percentage points to –3.3%. This is the fifth time in six weeks that the bull-bear spread is below its historical average of 6.5%.
This week’s special question asked AAII members how they would describe the current valuation of stocks. Here are the responses:
- Valuations are mixed, with some stocks expensive and others cheap: 44.4%
- Stocks, in general, are overvalued: 32.3%
- Stocks, in general, are fairly valued: 16.0%
- Stocks, in general, are undervalued: 3.9%
- Not sure/no opinion: 3.4%
Bullish: 31.3%, down 3.1 points
Neutral: 34.1%, down 2.3 points
Bearish: 34.6%, up 5.4 points
Bullish: 37.5%
Neutral: 31.5%
Bearish: 31.0%
See more Sentiment Survey results.

September 14, 2023 Current Valuation Ranges for Stocks
September 7, 2023 Guidelines for Selling Stocks
August 31, 2023 Interest Rates Are Higher. Your Taxes Could Be Too.
August 24, 2023 August Charts of Interest: More Costly to Finance Big Purchases

Discussion
Barry from TX posted over 3 years ago:
Charles, I will lay odds of "6 to 5 and pick 'em" that we can get better odds on every event described in this article at Bally's than from Mr. Market.
You need to log in as a registered AAII user before commenting.
Create an account