

Guidelines for Adding and Removing Stocks, Part 1
by Charles Rotblut | September 03, 2020
When we introduced the project we’ve code-named “The AAII Way,” some AAII members asked us to include rules governing the addition and deletion of stocks. The challenge in providing specific rules is the varied manners in which individual investors trade. Laying out specific rules for a value-oriented, buy-and-hold strategy won’t necessarily be of use to a growth-oriented investor who is willing to trade more frequently.
There is a middle ground between giving specific rules and simply telling investors to write down what would prompt them to buy and sell. (Though we strongly believe every investor—be they an individual or institutional investor—should have written buy and sell rules.) The middle ground is to provide guidelines based on investing style. This will help each of you to formulate rules based on your preferences.
We’re going to start the conversation this week. The initial conversation will carry over until at least next week’s Investor Update. Hence, the “Part 1” in today’s title.
Before getting into specifics, there are broad characteristics of successful stock investing strategies for all types of investors—from the short-term chartists to those who seek to minimize turnover as much as possible. They include:
• Understanding why you bought a stock and what changes would cause you to sell it;
• A systematic and repeatable process for deciding what to buy and sell;
• Simple enough for you to fully understand and routinely follow;
• Cost effective;
• Reflective of your investing time horizon, allocation needs, desired turnover levels and tolerance for risk;
• Require only as much time as you are reasonably able and willing to devote;
• Written or typed rules that are easily accessible when you need to make a decision.
To help you take those concepts and apply them into rules to follow for your own portfolio, I’ll use one of our model portfolios and stock screens as a source for ideas. The starting point will be for those of you who seek to hold a blended portfolio of individual stocks.
A blended portfolio encompasses a broad mix of stocks. A simple example is the S&P 500 index. A better example would be an exchange-traded fund (ETF) like the Vanguard Extended Market ETF (VXF). The Vanguard Extended Market holds 3,250 stocks.
This is far too many stocks for individual investors like you or me to hold. And the truth is, you can get away with holding a fraction of that amount. AAIl’s Stock Superstars Report does this. This 40-stock portfolio achieves a blended-approach by utilizing four different strategies based on well-known investing gurus. Those strategies are William O’Neil’s CAN SLIM (momentum and growth), David Dreman’s contrarian and value-oriented approach, James O’Shaughnessy’s quantitative composite approach (value, financial strength and earnings quality) and John Neff’s growth at reasonable price approach.
The key to the Stock Superstars Report portfolio is the existence of different rules for each group. A stock may be removed from the Group 1 O’Neil portfolio because of either a deterioration of growth or weak price momentum. Conversely, a high valuation could prompt a stock to be removed from the Group 2 Dreman portfolio. Stocks are selected, analyzed, added and removed according to the rules for each portfolio group.
With any model portfolio, it is important to follow the rules. Those rules reflect the strategy that the portfolio is designed to implement. Spend the time reading through them, including any guidelines about following the model portfolio.
Those of you who prefer a more do-it-yourself approach to building a blended portfolio could combine stocks identified from different stock screens. For the sake of discussion, let’s say you like the idea of using strategies based on investing gurus. You would pay attention to the factors—the characteristics of the stocks each screen identifies—to build a diversified portfolio.
I’ll use four different AAII guru stock screens to illustrate the concept, though there are many other combinations of the 60+ stock screens on AAII.com you could create. The O’Shaughnessy Tiny Titans screen would get you exposure to small stocks, the Driehaus Revised methodology would provide growth and momentum, the Graham Enterprising Investor Revised approach would get you value and quality, while the Buffettology Sustainable Growth screen would cover growth and quality.
In constructing a portfolio from different stock screens, you would first want to decide how many stocks you want from each screen. The Stock Superstars Report’s goal is to hold 10 stocks in each of the four portfolio groups for a total of 40 stocks. You could hold fewer stocks based on your preferences. The lower limit for a diversified portfolio is 10 stocks, though the low number assumes that the stocks are from different industries and have varying characteristics.
The rules regarding portfolio additions and deletions would be based on each screen. Let’s use the Driehaus Revised screen for the sake of this discussion. It seeks earnings growth, strong price momentum and positive earnings surprises. Your portfolio rules could be to rely on the screen for a list of candidates and first favor the stocks ranking highest on the key trait you want to focus on (e.g., strongest 12-month earnings growth). The deletion rules may then seek to remove stocks when earnings growth slows, price momentum weakens and/or the company misses analysts’ expectations. The deletion rules—as you can see—are the opposite of the traits sought by the strategy.
A key to pulling this off is to understand which traits made the stock a candidate for investment and which traits would cause the stock to no longer match the strategy. In combining strategies, there would be separate rules for each strategy.
I’ll be continuing this discussion next week with a focus on specific investing styles. In the meantime, I encourage you to think about your personal strategy and which traits in a stock are important to you. You can use our Portfolio Composition and Notes Worksheet to jot those down for each stock you own.
Finally, a brief correction to last week’s commentary. I described T. Rowe Price as being a mutual fund company lacking a brokerage arm. It’s not well-publicized, but the company does offer brokerage services to investors who have an account with them.
Try out The AAII Way worksheets we’ve created so far and give us your feedback in the comments section for each. We want them to be useful to you.
1. Identifying and Prioritizing Your Financial Goals Worksheet
2. Our Revised Risk Tolerance Worksheet
3. A Worksheet for Determining How Your Portfolio Is Managed
4. Financial Account Inventory Worksheet

-
AAII Screen Characteristics – The value, growth, size and momentum characteristics of the stocks identified by our 60+ stock screens.
-
Momentum Investing the Richard Driehaus Way – Those of you interested in learning more about the Driehaus approach will find this 2018 AAII Journal article helpful.
Pessimism among individual investors about the short-term direction of the stock market rebounded, continuing its streak of staying above 40%. The latest AAII Sentiment Survey also shows small declines in bullish and neutral sentiment.
Bullish sentiment, expectations that stock prices will rise over the next six months, declined 1.3 percentage points to 30.8%. Bullish sentiment remains below its historical average of 38.0% for the 26th consecutive week and the 31st week this year.
Neutral sentiment, expectations that stock prices will stay essentially unchanged over the next six months, fell by 0.9 percentage points to 27.4%. This is the 32nd time out of 34 weeks that neutral sentiment is below its historical average of 31.5%.
Bearish sentiment, expectations that stock prices will fall over the next six months, rebounded by 2.1 percentage points to 41.8%. Bearish sentiment is above its historical average of 30.5% for the 28th consecutive week and the 30th time this year.
Pessimism is above 40% for the 23rd time out of the past 26 weeks. Bearish sentiment readings above 40.2% are unusually high (more than one standard deviation above average). Both bullish and neutral sentiment are within their typical historical ranges.
The persisting high level of pessimism reflects concerns about the coronavirus pandemic and the economy. However, some AAII members have been encouraged by the rebound in the market from its March lows and positive second-quarter earnings. Other factors influencing AAII members’ sentiment include the economy, corporate earnings, valuations, unemployment, the November elections and interest rates.
This week’s special question asked AAII members to share their thoughts about second-quarter earnings. One out of three respondents (33%) describe earnings as surprisingly positive given the current economic environment. Many of these respondents also note that many companies exceeded their expectations and analysts’ forecasts. In comparison, 18% of respondents say that quarterly earnings were overly optimistic and overpriced. A majority within this group also state that they are concerned that the market is considerably higher than what the current economy is supporting.
About 17% of respondents say that while second-quarter earnings exceeded their expectations, they anticipate third-quarter and full-year results to take a hit. In addition, 15% of respondents say that the positive earnings surprise was likely attributable to low interest rates, high demand and favorable funding. Finally, 14% of respondents say that quarterly earnings were about what they expected and in line with analysts’ forecasts.
Here is a sampling of the responses:
- “They were about in line with expectations given the coronavirus pandemic lockdown in the second quarter but may have been propped up by government payouts. Will be curious about third-quarter earnings when some assistance will expire.”
- “Surprised by positive earnings and the beats to forecasts. Even more surprising is how the market is so much higher than what the economy is currently supporting.”
- “The market has been driven up by stimulus and liquidity that favors large companies. Mom and pop investors have by and large followed the advice of the advisory industry of not abandoning equity during volatility. So, there will not be much outflow of money from the market. Accordingly, there is more money chasing fewer buying opportunities. The market is expensive and will be more so.”
- “Second-quarter earnings reports appeared much better than analysts had previously forecasted. In other words, surprisingly positive considering the events that occurred in the quarter.”
- “Obviously, earnings will be very mixed. Great for companies who were open during the quarter or online enterprises like Zoom and Amazon, but not good for traditional companies like restaurants and brick & mortar retailers.”

Bullish: 30.8%, down 1.3 points
Neutral: 27.4%, down 0.9 points
Bearish: 41.8%, up 2.1 points
Bullish: 38.5%
Neutral: 31.0%
Bearish: 30.5%
AAII Asset Allocation Survey
The latest AAII Asset Allocation Survey shows individual investors’ exposure to equities reaching a six-month high in August. At the same time, cash allocations fell to their lowest level in six months.
Stock and stock fund allocations rose 2.6 percentage points to 64.8%. This is the largest equity allocation since February 2020 (66.1%). Allocations to stocks and stock funds are above the historical average of 61.0% for the 88th time out of the past 92 months.
Bond and bond fund allocations increased 1.0 percentage points to 18.9%. This is the 18th consecutive month and the 19th month since the start of 2019 that fixed-income exposure is above its historical average of 16.0%.
Cash allocations fell 3.6 percentage points to 16.3%. Cash exposure was last lower in February 2020 (14.8%). The historical average is 23.0%.
Individual investors’ exposure to equities rose last month as some of the major indexes set or neared their record highs. Optimism about the short-term direction of the stock market gradually rose throughout the month, though continued to remain below-average in the weekly AAII Sentiment Survey.
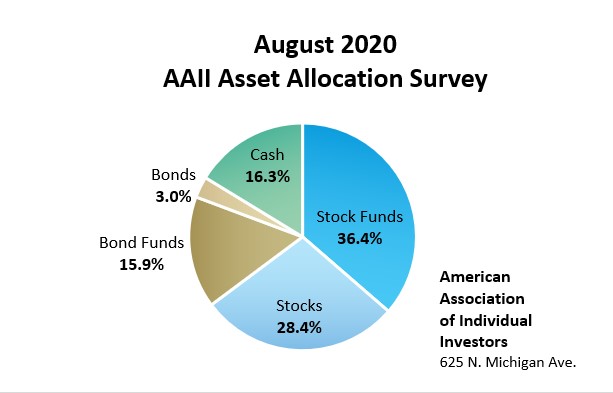
August AAII Asset Allocation Survey results:
- Stocks and Stock Funds: 64.8%, up 2.6 percentage points
- Bonds and Bond Funds: 18.9%, up 1.0 percentage points
- Cash: 16.3%, down 3.6 percentage points
August AAII Asset Allocation Survey details:
- Stocks: 28.4%, down 0.2 percentage points
- Stock Funds: 36.4%, up 2.8 percentage points
- Bonds: 3.0%, down 0.4 percentage points
- Bond Funds: 15.9%, down 1.4 percentage points
Historical Averages:
- Stocks/Stock Funds: 61.0%
- Bonds/Bond Funds: 16.0%
- Cash: 23.0%
The numbers are rounded and may not add up to 100%.
The AAII Asset Allocation Survey has been conducted monthly since November 1987 and asks AAII members what percentage of their portfolios are allocated to stocks, stock funds, bonds, bond funds and cash. The survey and its results are available online at: www.aaii.com/investor-surveys.
- Stocks and Stock Funds: 64.8%, up 2.6 percentage points
- Bonds and Bond Funds: 18.9%, up 1.0 percentage points
- Cash: 16.3%, down 3.6 percentage points
- Stocks: 28.4%, down 0.2 percentage points
- Stocks Funds: 36.4%, up 2.8 percentage points
- Bonds: 3.0%, down 0.4 percentage points
- Bond Funds: 15.9%, up 1.4 percentage points
- Stocks/Stock Funds: 62.0%
- Bonds/Bond Funds: 16.0%
- Cash: 22.0%
Take the Asset Allocation Survey.
August 27, 2020 Considerations for Picking a Mutual Fund or ETF
August 20, 2020 Stocks, Funds or Both?
August 13, 2020 Ideas for Implementing Your Fixed-Income Allocation
August 6, 2020 Investment Expenses Are a Drag; Tips for Reducing Them

Discussion
No comments have been added yet. Add your thoughts to the discussion!
You need to log in as a registered AAII user before commenting.
Create an account