

Two Shorter-Term Strategies for Sector ETFs
by Charles Rotblut | August 08, 2019
In our 2019 exchange-traded fund (ETF) guide, I made a mention of two trading strategies. One is Doug Ramsey’s Bridesmaid Strategy. (Ramsey is the chief investment officer of Leuthold Group.) The other is Sam Stovall’s six-month seasonal rotational strategy. (Stovall is the chief investment strategist at CFRA Research.) Today, I’m going to discuss both in greater detail.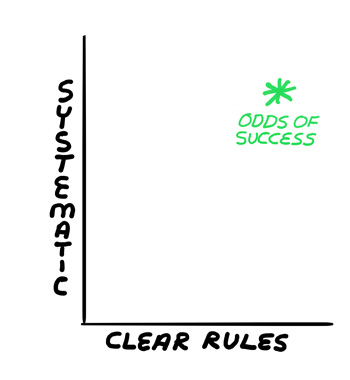
The two strategies were chosen as examples because they are systematic and have clear rules to follow. There are routine and clearly defined steps for implementing each strategy. When combined, these traits increase the odds of success because any strategy is only as good as your ability to implement it.
Ramsey’s Bridesmaid strategy ranks each of the S&P 500 index sectors based on trailing 12-month returns best to worst. (The real estate sector, which is a relatively new sector, is excluded. The strategy was first tracked in 2006, when real estate was not a separate sector.) Anyone can do this by calculating the performance of ETFs that are tracking those sectors.
Someone hearing about this strategy might think that the strategy would call for buying an ETF representing the best-performing sector. A contrarian might take the opposite position and suggest buying the worst-performing sector. Both would be wrong. Ramsey’s analysis shows that buying an ETF tracking the second-best performing sector (aka, the bridesmaid) is the best strategy. From 1991 through June 2019, this strategy has realized a 12.4% annualized return versus a 10.2% return for the S&P 500.
What’s interesting about the strategy is that one-year holding periods are not required to realize the outperformance. It also works with semiannual, quarterly and monthly rebalancing. Monthly rebalancing has resulted in the highest returns at 14.3% annualized. Tax location is a significant consideration since the level of turnover with monthly rebalancing will result in short-term capital gains being realized if the strategy is followed in a taxable account. The wash sale rule can also come into play since losses cannot be realized on substantially identical securities repurchased within 30 days.
Stovall’s seasonal rotational strategy is a play on the best and worst six-month periods for stocks. Since World War II, U.S. stocks have realized their highest returns during the months of November through April. They’ve experienced their lowest returns between May and October. (Despite the moniker of “worst,” the annualized historical returns over this period are still modestly positive.)
During the worst six-month period, which we’re currently in, ETFs representing the health care and consumer staples sectors are held. Once the calendar turns to November, ETFs tracking the consumer discretionary, industrials, materials and technology sectors are held. In both cases, the portfolio is allocated equally to each sector fund.
This strategy’s performance is within the range of the Bridesmaid Strategy’s. The CFRA-Stovall Large Cap Seasonal Rotation Index has realized a 13.7% annualized return between April 30, 1990, and April 26, 2019. Again, taxes are an issue if this strategy were to be implemented in a taxable account.
For both strategies, the ability to stick with them is key. Even though their rules are straightforward, depending on the prevailing headlines and market conditions, potentially one or both strategies may prompt you to allocate to a sector you don’t feel comfortable buying into. At the same time, not selling when you are supposed to could hurt returns. The same is true with other rotational and tactical strategies.
Neither strategy outperforms every year, either. The Bridesmaid Strategy’s win rate (meaning years outperforming the S&P 500) is 55% and 62%, based on annual and monthly rebalancing, respectively. The seasonal rotational strategy has a 72% win rate over its measured period. In exchange for realizing a greater magnitude of long-term wealth, you have to be willing to endure some shorter-term underperformance when following either strategy.
ETFs that can be used for either strategy can be found in the Short-Term Investor section of our ETF Guide. The Pacer CFRA-Stovall Equal Weight Seasonal Rotation ETF (SZNE), which is not listed in this section but included in our expanded listings, is another option for Stovall’s strategy. This ETF tracks a version of the seasonal rotational strategy using equally weighted instead of market-cap-weighted sector holdings.

-
The Four Groups of ETFs – When buying an ETF, it’s important to know what strategy it is actually following.
-
An In-Depth Look at the Tax Consequences of Asset Location – I made mention to asset location above. This article explains why the choice of account you use for a given investment or strategy impacts the aftertax return you realize.
Nearly half of individual investors now describe their short-term outlook for stocks as “bearish.” The latest AAII Sentiment Survey also shows large drops in bullish and neutral sentiment.
Bullish sentiment, expectations that stock prices will rise over the next six months, plunged 16.8 percentage points to 21.7%. Optimism was last lower on December 12, 2018 (20.9%). Bullish sentiment is below its historical average of 38.5% for the 24th time this year.
Neutral sentiment, expectations that stock prices will stay essentially unchanged over the next six months, fell 7.4 percentage points to 30.1%. Neutral sentiment was last lower on January 23, 2019 (30.0%). The drop ends an 11-consecutive-week streak of readings above the historical average of 31.0%.
Bearish sentiment, expectations that stock prices will fall over the next six months, jumped 24.1 percentage points to 48.2%. Pessimism was last higher on December 26, 2018 (50.3%). Bearish sentiment is above its historical average of 30.5% for the 10th time in 13 weeks.
Bullish sentiment is at an unusually low level, while bearish sentiment is at an unusually high level. Historically, the S&P 500 index has experienced above-average and above-median returns during the six- and 12-month periods following unusually low readings.
The survey period runs from Thursday through Wednesday. Reminders to take the survey are sent out every Monday.
Many individual investors have been monitoring trade negotiations, particularly between the U.S. and China. Last Thursday’s threat by President Trump to impose new tariffs and the subsequent drop in stock prices likely had a significant impact on this week’s readings. Additionally, a separate survey we recently conducted among AAII members found that 48% expect a recession to start within the next 12 to 24 months.
Also having an influence on sentiment are Washington politics, geopolitics, valuations, corporate earnings, monetary policy and interest rates.
This week’s special question asked AAII members what they thought about the Federal Open Market Committee’s (FOMC) decision to lower interest rates for the first time since 2008. More than 30% responded that the decision to lower rates was a bad idea. Additionally, 13% of respondents say that the decision was premature and will limit the Fed’s options when a recession is in full force.
Approximately 23% say that the decision to lower rates is the correct response to ongoing trade wars and global economic slowdowns. Nearly 20% of respondents describe themselves as uncertain and say that they don’t believe the decision will have a long-term impact. Finally, 14% of respondents state that the decision was politically motivated and not necessarily needed.
Here is a sampling of the responses:
- “Feels like a bad decision. They should have maintained the rate so that there would be more room to adjust rates when needed.”
- “I think the Fed’s response was just right. The market needs stability to succeed now, not wild gyrations. Let’s wait for the effect from this reduction and consider a change next year.”
- “I think the decision is positive in terms of balancing against negative market factors like Chinese tariffs and currency devaluation from China.”
- “Strongly disagree. Powell gave into political influence. Interest rates are a fundamental tool of the Fed and the reduction was premature.”
- “Neutral. I am not convinced that it was necessary with unemployment being at record lows and the stock market at record highs.”

Bullish: 21.7%, down 16.8 points
Neutral: 30.1%, down 7.4 points
Bearish: 48.2%, up 24.1 points
Bullish: 38.5%
Neutral: 31.0%
Bearish: 30.5%
August 1, 2019 Magnitude Versus Frequency of Outperformance, Plus the Fed’s Rate Cut
July 25, 2019 Spotting Dividend Warning Signs
July 18, 2019 How the VMQ Stocks Momentum Indicator Was Changed
July 11, 2019 The Financial Markets’ Mixed Signals

Discussion
Jan from NY posted over 7 years ago:
What is the maximum drawdown for the Bridemaid strategy.
You need to log in as a registered AAII user before commenting.
Create an account