

Revisiting the Meme Stock Craze
by Charles Rotblut | June 06, 2024
Featured Tickers: GME
GME
Some lessons are hard to learn. Such is the case with meme stocks. Shares of GameStop Corp.  (GME) have been on a run since Keith Gill (aka “Roaring Kitty”) restarted posting about the company on social media last month. The stock jumped 81% between May 12 and yesterday.
The meme stock craze was never about fundamentals. Though Gill originally argued why GameStop was undervalued, he didn’t gain a significant following until he started posting memes and screenshots of his brokerage account in 2020. After going on hiatus in 2021, Gill returned to social media last month by posting more memes. This past weekend, he shared screenshots from his brokerage account showing positions in GameStop stock and June call options.
 The volume numbers show how large of an effect those new posts have had. Between January 2 and May 10, 5.8 million shares of GameStop traded on an average day. Daily trading activity since then has averaged 81.5 million shares.
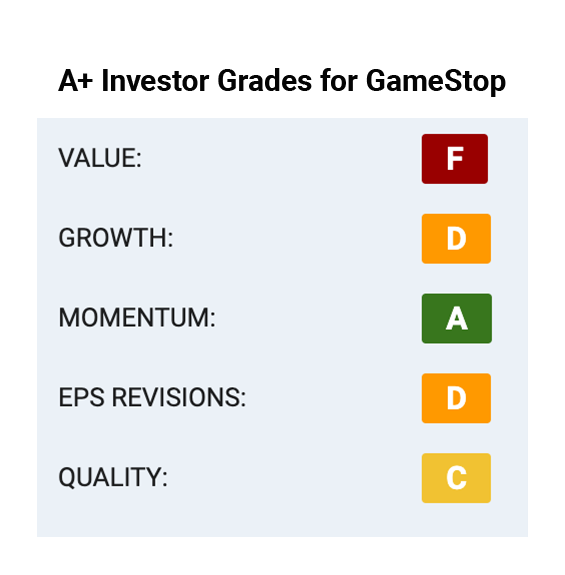
Yet, GameStop’s fundamentals are not great. A walk through the A+ Investor Grades will demonstrate this.
The company’s Value Grade is F in part due to a high price-to-book-value (P/B) ratio and a high ratio of enterprise value to earnings before interest, taxes, depreciation and amortization (EBITDA). GameStop’s shareholder yield is negative because the company’s share count has been rising. Last month, GameStop sold an additional 45 million shares in a secondary offering. The price-earnings (P/E) ratio is nonexistent because the company was barely profitable last year.
Sales have fallen at an 8.6% annualized pace over the past five years. Cash from operations has only been positive during two out of the last five years. The combination explains why the stock’s Growth Grade is D.
Underlying GameStop’s Quality Grade of C are differing indicators. Total liabilities relative to assets have been declining—which is a positive. Despite GameStop’s business challenges, the Z double prime bankruptcy risk (Z) score of 6.57 suggests the company is not at risk of incurring financial distress. The gross-income-to-assets ratio of 47.8% may look good, but it is getting a lift from declining total assets. The company’s return on assets (ROA) and return on invested capital (ROIC) are barely positive because of GameStop’s low level of profitability.
(Looking at a company’s financial statements while analyzing financial ratios provides a clearer picture of a company’s financial strength.)
The Earnings Estimate Revisions Grade is D (negative). The LSEG I/B/E/S consensus estimate for fiscal 2025 has been lowered to $0.010 per share from $0.028 per share three months ago. GameStop will announce its first-quarter 2024 results next week. It has already guided for a drop in quarterly sales and a net loss.
The final A+ Investor Grade is the Momentum Grade. Gill can take credit for the stock’s very strong Momentum Grade of A. During the last 13 weeks, shares of GameStop have outperformed 98% of all stocks. However, the stock fell in value during each of the three prior quarters.
Overall, these grades don’t paint a favorable picture of the stock. What they do show is the importance of doing your own analysis. Sadly, the mistakes many in the meme stock crowd made before are occurring again.
Influencers and the Ethics of Disclosure
E-Trade is reportedly considering closing Gill’s brokerage account over potential stock market manipulation. The Wall Street Journal says Gill bought “a large volume of GameStop options” prior to resurfacing on social media.
This is not the first time that questions about an influencer’s conflict of interest have been raised and it won’t be the last. There is a long history of people talking up stocks for their own benefit. I can’t say whether Gill purposely sought to boost the value of holdings with his latest posts, but the uncertain timing of the transactions raises red flags.

-
Reddit, Robinhood and Lessons From the Meme Stock Craze
The technology that made it possible for people to actively trade for free and send a stock’s price up rapidly also works to your advantage as an investor and a saver. -
The Eight Metrics AAII Uses to Identify Quality Stocks
AAII’s A+ Quality Grade encompasses a comprehensive set of financial indicators to identify high-quality stocks. -
Active Investors Can Still Win in “Efficient” Markets
In the newly released June 2024 AAII Journal, Brian Haughey shows that to achieve above-average returns, you need to be better at interpreting information than the average investor. -
On Money and Transparency: Wealth and What It’s Worth
In her latest My Investing Discoveries blog post, Anine Sus challenges attitudes toward money and transparency that are based on societal expectations of success.
AAII Sentiment Survey
Pessimism among individual investors about the short-term outlook for stocks increased in the latest AAII Sentiment Survey. Meanwhile, both optimism and neutral sentiment decreased.
Bullish sentiment, expectations that stock prices will rise over the next six months, decreased 0.1 percentage points to 39.0%. Bullish sentiment is above its historical average of 37.5% for the 30th time in 31 weeks.
Neutral sentiment, expectations that stock prices will stay essentially unchanged over the next six months, decreased 5.2 percentage points to 29.0%. Neutral sentiment is below its historical average of 31.5% for the seventh time in 12 weeks.
Bearish sentiment, expectations that stock prices will fall over the next six months, increased 5.3 percentage points to 32.0%. Bearish sentiment is above its historical average of 31.0% for the fourth time in eight weeks.
The bull-bear spread (bullish minus bearish sentiment) decreased 5.3 percentage points to 7.0%. The bull-bear spread is above its historical average of 6.5% for the fifth time in eight weeks.
This week’s special question asked AAII members which of the following they are using the most to generate interest income.
Here is how they responded:
- Savings accounts/certificates of deposit (CDs)/money market accounts and funds: 52.9%
- U.S. Treasurys: 16.2%
- Investment-grade corporate bonds: 7.3%
- High-yield corporate bonds: 6.8%
- Other/not sure: 13.6%
Bullish: 39.0%, down 0.1 points
Neutral: 29.0%, down 5.2 points
Bearish: 32.0%, up 5.3 points
Bullish: 37.5%
Neutral: 31.5%
Bearish: 31.0%
See more Sentiment Survey results.

AAII Asset Allocation Survey
Individual investors’ allocations to equities increased in the May Asset Allocation Survey.
Stock and stock fund allocations increased 1.0 percentage points to 70.4%. Stock and stock fund allocations are above their historical average of 61.5% for the 48th consecutive month. Stock and stock fund allocations were last higher in December 2021 (70.5%).
Bond and bond fund allocations decreased 0.1 percentage points to 13.8%. Bond and bond fund allocations are below their historical average of 16.0% for the fourth time in seven months. Bond and bond fund allocations were last lower in November 2022 (13.6%).
Cash allocations decreased 0.8 percentage points to 15.8%. Cash allocations are below their historical average of 22.5% for the 18th consecutive month. Cash allocations were last lower in December 2021 (15.1%).
- Stocks and Stock Funds: 70.4%, up 1.0 percentage points
- Bonds and Bond Funds: 13.8%, down 0.2 percentage points
- Cash: 15.8%, down 0.8 percentage points
- Stocks: 33.6%, up 2.7 percentage points
- Stocks Funds: 36.8%, down 1.7 percentage points
- Bonds: 4.5%, down 0.1 percentage points
- Bond Funds: 9.3%, down 0.0 percentage points
- Stocks/Stock Funds: 62.0%
- Bonds/Bond Funds: 16.0%
- Cash: 22.0%
Take the Asset Allocation Survey.
May 30, 2024 Answers to Common Questions About QCDs
May 23, 2024 What Faster Trade Settlements Mean for Investors
May 16, 2024 May Charts of Interest: Buybacks Are Rising
May 9, 2024 Does It Make Sense for BlackRock to Add Annuities to Retirement Plans?

Discussion
John L from NJ posted over 2 years ago:
The action in Game Stop is making a mockery of the efficient market hypothesis.
Barry Johnson from TX posted over 2 years ago:
I am not uncertain (as Dollar Bill from Billions would say) that Gene Fama's EMHo does not say markets produce "fair" prices or price assets fairly. EMHo says that due to the millions of shares traded daily (or IN GME's case, BILLIONs of shares traded daily) are "efficient" because EVERY sell/buy transaction results in price that is agreed upon at that nano moment in time when each trade is executed. The only way a price can change is another transaction occurs in the next nano-second because another buyer and seller MIGHT agree on a different price for whatever "rational" of "emotional" reasons each holds at the time they agree to the price of the trade. Fama never claimed that the market prices that EMHo produces result in a value that equals the type of "values" that fundamental analysis that Charles conducted using historical accounting data in the AAII database. I am not uncertain that Charles would be the first to agree that the "fair market value" is always an estimate and that a "CERTAIN" FMV estimate -- absolute accuracy - is UNKNOWABLE and that if a quoted FMV just happens to equal the market price at a nanosecond intime it is it is still subject to being reset because any price used in any analysis is always an ephemeral. That is why we call them "market prices" and not "FMVs." A corollary to the EMHo postulation is that a "TRUE" discounted FMV -- the discounted sum of the future values of income streams a stock generates -- are UNKNOWABLE because the FMV equation requires the FMV calculation requires the assumption of a discount rate for all future periods. Any FMV value calculated is ALWAYS an approximation of an UNKNOWABLE future even it is only for one nanosecond in the future before the next trade.
John L from NJ posted over 2 years ago:
According to the Efficient Market Hypothesis, stocks ALWAYS trade at their fair value on exchanges, making it impossible for investors to purchase undervalued stocks or sell stocks for inflated prices. Yet on April 17, 2024 Game Stop was $10.3 / share and a month later on May 16 Game Stop was at $22.2 / share. Exactly what fundamental shift in future net profits could explain the more than doubling in price in 30 days? Did Game Stop discover a gold mine in Nevada that greatly increased the value of this company? No. A pump and dump artist called "Roaring Kitty" returned to social media! There is something wrong with the Efficient Market Hypothesis.
You need to log in as a registered AAII user before commenting.
Create an account