

What Two Bond Market Indicators Are Telling Investors at Midyear
by Charles Rotblut | June 13, 2024
As one of the key contributors to AAII’s new Essential Investing (EI) Course, I’m excited to share my insights through the wealth-building and investing fundamentals modules. Whether you’re a beginner, intermediate or advanced investor, you can gain practical skills to confidently navigate the financial markets and create a resilient wealth-building plan. Learn more about the EI Course.
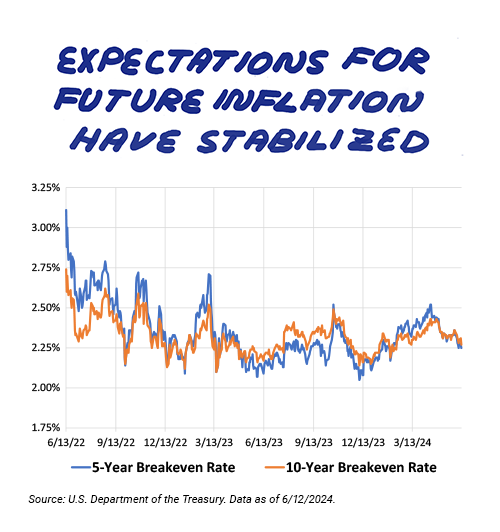
Given yesterday’s inflation data and updated Federal Open Market Committee (FOMC) projections, I am sharing an updated look at two bond market indicators. The first is the breakeven inflation rate. The second is the yield curve.
Since I last wrote about them in mid-December, neither metric has changed significantly. This is not surprising given that headline inflation has been holding steady and the first interest rate cut has yet to occur. The breakeven rate and the yield curve help to illustrate the market’s response to economic data and monetary policy.
Breakeven rates signal what bond market participants expect inflation to be in the next five years and the next 10 years. Unlike economic forecasts, these are based on where traders and investors have put their money to work.
Both the five- and 10-year breakeven rates have been largely range-bound over the past 15 months. Though there has been some upward and downward movement, the absolute range is small. This suggests traders continue to expect inflation rates to stabilize at a level above the 2% that Federal Reserve chairman Jerome Powell is targeting.
The yield curve plots the comparative yields of Treasurys with various maturities. I once again included the yield curves at the time of the first interest rate hike (March 2022) and the last interest rate hike (July 2023) to provide comparisons. There isn’t much difference between the current yield curve and where it was when the FOMC switched to its current hold-and-wait strategy last summer. (The yield curve was essentially the same last December too.)
Higher yields at the shorter end of the curve continue to explain why you can get juicy interest rates on savings accounts, money market accounts and certificates of deposit (CDs). The lower long-term interest rates signal expectations by traders for interest rates to come down in the future.
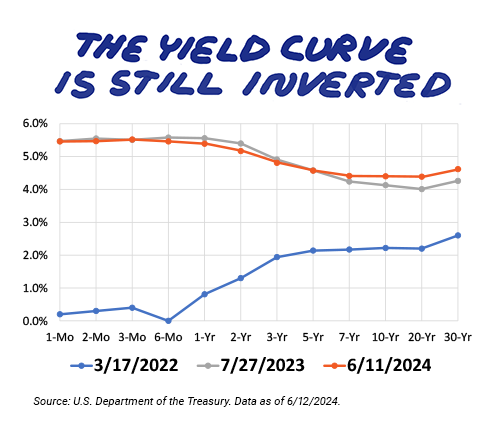
Duke University professor Campbell Harvey’s research found that recessions follow periods when three-month Treasury bill yields are above those of the 10-year Treasury bond. Presently, the U.S. economy has gone longer than usual without experiencing a recession after the yield curve has inverted. Harvey continues to expect a recession to occur. Time will tell if the yield curve’s perfect record as a forewarning of recessions stays intact.
I continue to suggest shopping around for attractive yields on cash savings. I also still view equities as the best option for long-term capital appreciation given what they have historically returned. The opportunity cost of keeping long-term savings in cash equivalents since the 2022 bear market ended is significant in terms of lost wealth.
When the Fed will make its first interest rate cut remains the $64,000 question. Expectations for the number of interest rate cuts occurring this year have been falling. Even the new “dot plot,” which charts the expectations for FOMC members, reflects the “higher for longer” mentality. While humans prefer certainty, higher returns are only possible when there is uncertainty to be compensated for.

-
Bond Yields’ Role as a Recession Warning Signal
Campbell Harvey discussed his research on yield curves and recessions with AAII just after the yield curve inverted in 2019. -
Yield Shift Increases Relative Attractiveness of Bonds
The Treasury bond’s yield was approaching a full percentage point above the earnings yield for the S&P 500 index as of early May 2024. -
2024 Robo-Advice Landscape: Industry Shifts and Leading Platforms
In the June AAII Journal, Ken Schapiro’s annual update on the robo industry reports on recent moves that illustrate the difficulty of making a profit while offering advisory services at rock-bottom prices.
AAII Sentiment Survey
Pessimism among individual investors about the short-term outlook for stocks decreased in the latest AAII Sentiment Survey. Meanwhile, both optimism and neutral sentiment increased.
Bullish sentiment, expectations that stock prices will rise over the next six months, increased 5.6 percentage points to 44.6%. Bullish sentiment is above its historical average of 37.5% for the 31st time in 32 weeks.
Neutral sentiment, expectations that stock prices will stay essentially unchanged over the next six months, increased 0.7 percentage points to 29.7%. Neutral sentiment is below its historical average of 31.5% for the eighth time in 13 weeks.
Bearish sentiment, expectations that stock prices will fall over the next six months, decreased 6.3 percentage points to 25.7%. Bearish sentiment is below its historical average of 31.0% for the fifth time in nine weeks.
The bull-bear spread (bullish minus bearish sentiment) increased 11.9 percentage points to 18.9%. The bull-bear spread is above its historical average of 6.5% for the sixth consecutive week.
This week’s special question asked AAII members which factor is most influencing their six-month outlook for stocks.
Here is how they responded:
- The economy and/or inflation: 39.8%
- Monetary policy/interest rates: 20.8%
- Corporate earnings: 17.8%
- Valuations: 15.5%
- Other: 6.1%
Bullish: 44.6%, up 5.6 points
Neutral: 29.7%, up 0.7 points
Bearish: 25.7%, down 6.3 points
Bullish: 37.5%
Neutral: 31.5%
Bearish: 31.0%
See more Sentiment Survey results.

June 6, 2024 Revisiting the Meme Stock Craze
May 30, 2024 Answers to Common Questions About QCDs
May 23, 2024 What Faster Trade Settlements Mean for Investors
May 16, 2024 May Charts of Interest: Buybacks Are Rising

Discussion
Barry Johnson from TX posted over 2 years ago:
Charles, thanks for your helpful insights on the majority of factors that worry AAII members while they are cursed to “live in interesting times” – inflation (40%) and interest rates (21%). In his Beauty Contest Theory (in his 1936 General Theory), Lord J.M. Keynes demonstrated the value of being able to think beyond 1st level factors (like the ones reported in the recent AAII survey reported above) and to anticipate the impacts of 2nd and 3rd and deeper level factors when trying to predict the overall most likely final consensus from any survey. By surveying for the “most important factors,” the AAII survey neglected to collect AAII member assessments of the 2nd, 3rd, and other upstream factors that produce the “most important” factors. In your article, your analysis called out two examples of 2nd level factors. #1 the impact of “bond market participants” on breakeven interest rates, and #2 the impacts of the FOMC (monetary policy ) decision-making on yield curves. Given these two levels of analysis, the question then becomes what are the 3rd level factors influencing the 2nd level factors? What do “bond market participants” and FOMC members look at to make their guestimates. This requires investors to estimate what factors influence both interest rates and yield curves. These questions would be interesting topics for future surveys or maybe for an article. My point is that is important that investor look beyond level 1 (“headline”) factors which are always the outcomes of 2nd, 3rd, and other factors at deeper levels. If you don’t understand what is driving the 1st level headline factors, you will not know how to diversify your portfolio to minimize the impacts of “market risks” on portfolio returns. As you article suggest, equities will probably produce higher returns that bonds, but I have seen several articles suggesting that since the 2000-2001 dotcom “bubble” and the 2008-2009 “Great Recession” the expected return of equites will NOT be as high as historical rates have been due to deeper factors like the ones I am suggesting lurk in the depths. Persistent inflation and lingering yield curves may be early warning signals of a change in historical market dynamics. Cue the music from “Jaws.”
John L from NJ posted over 2 years ago:
Maybe both of these indicators tell us nothing! Break even rates tell us the market expectations for inflation; but how accurate has this "forecast" been in the past? How useful were these expectations just before inflation took off in 2021 and 2022? The difference in long and short interest rates in the past were a good proxy for bank's lending margins as they borrow short and lend long. When short rates are higher than long rates, banks lending margins are negative leading banks to reduce lending. Companies that relied on bank loans for expansion and perhaps ongoing operations (small value companies) would be starved for funds and start cutting back. Ultimately these cut backs would leading to lay offs and a recession. But that was when the Federal Reserve was targeting over night lending rates and would remove reserves from the banking system in order to increase short term rates. After 2008, the Federal Reserve changed to an abundant reserve policy and began paying banks interest on reserves held at the Federal Reserve. Now banks are not starved for funds when the short term rate is raised by the Federal Reserve. Instead they receive higher interest payments on their reserves at the Federal Reserve. Their margin now is essentially the difference between what they pay for deposits (my interest bearing checking accounts are still paying 0.01%) and the long term rate they receive on loans to business and consumers. So maybe now the yield curve doesn't describe bank's gross margin and is no longer a useful indicator of up coming recessions.
Patti R from AZ posted over 2 years ago:
To Barry's point: "Equities will probably produce higher returns that bonds, but I have seen several articles suggesting that since the 2000-2001 dotcom “bubble” and the 2008-2009 “Great Recession” the expected return of equities will NOT be as high as historical rates have been..." Then Barry comments on a change in historical market dynamics. Getting more general than interest rates into other market topics: It drives me crazy when AAII publishes articles from authors that use stock market data going back to 1926. Authors draw conclusions on various topics using this data. Just because the data is available doesn't mean it's still relevant and should be used. I believe that the markets are different today than they were 50 - 100 years ago. I think conclusions would be more relevant if they were based on more current data. Is that 50 years? Is that 25 years? I don't know. I think Barry calls out the importance of the effect of recent market dynamics to be able to draw conclusions relevant to the future.
You need to log in as a registered AAII user before commenting.
Create an account