

June Charts of Interest: High Concentration Is Covering Market Undercurrents
by Charles Rotblut | June 20, 2024
Featured Tickers: AAPL
GOOGL
MSFT
RSP
AAPL
GOOGL
MSFT
RSP
I had the privilege of helping shape AAII’s new Essential Investing (EI) Course with my presentations that focus on essential strategies for lasting wealth. Dive into my sessions—Mutual Funds 101, Investing 101 and Wealth-Building Process—where I break down complex investing concepts to make them accessible to everyone. Explore the EI Course content.
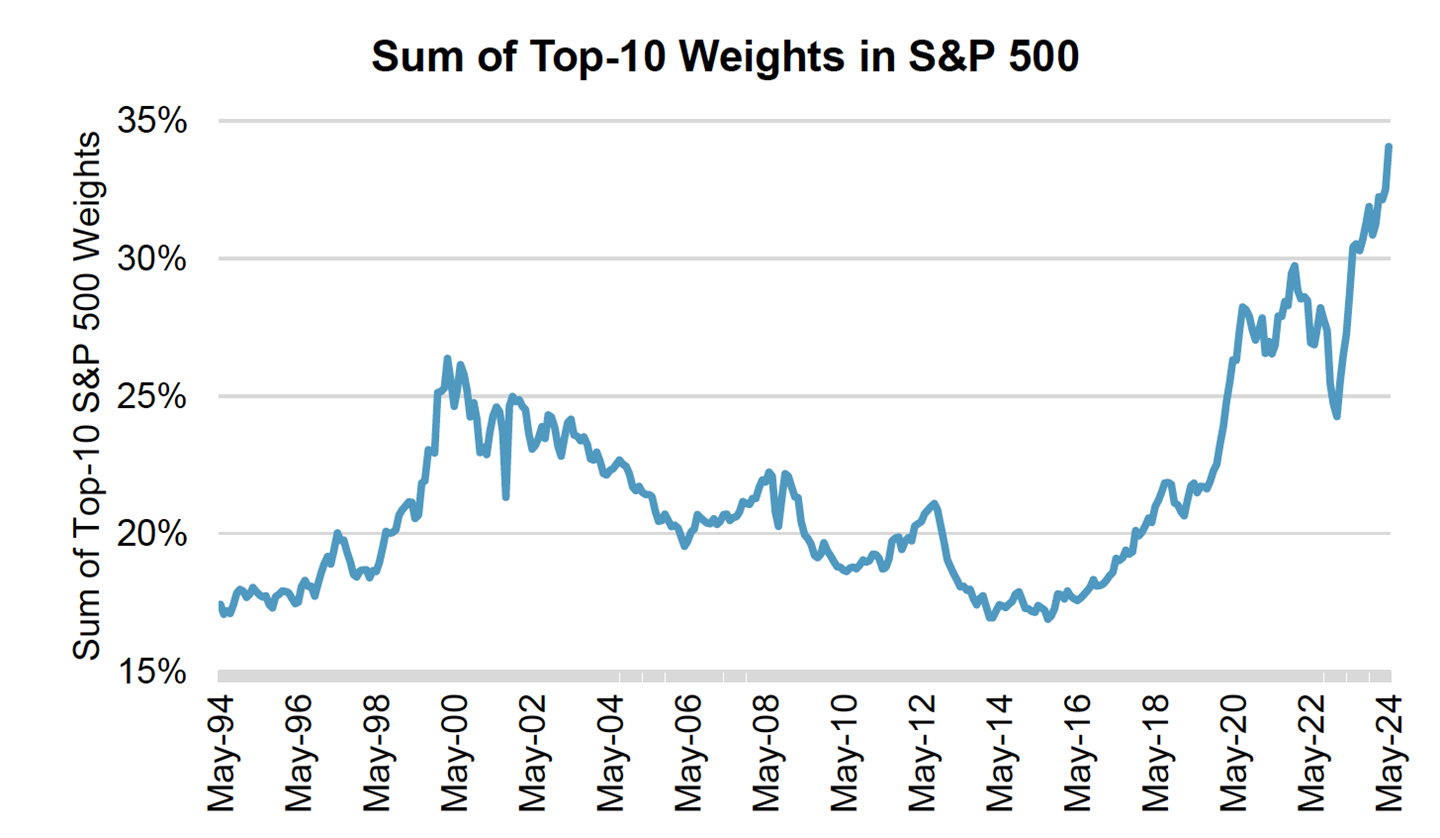
Many of you have seen me point out the S&P 500 index’s high level of concentration over the past several months. Well, it continues to get even higher.
“When it comes to measures of the market, May’s elephant in the room is concentration,” says S&P Dow Jones Indices. Currently, the combined weight of the top 10 largest constituents in the S&P 500 sums to 34%, the highest in multiple decades.
To put this number into perspective, S&P Dow Jones Indices defines the top quartile of concentration as 22.9% or higher.
Source: S&P Dow Jones Indices.
Time to Look at Buybacks and Dividends?
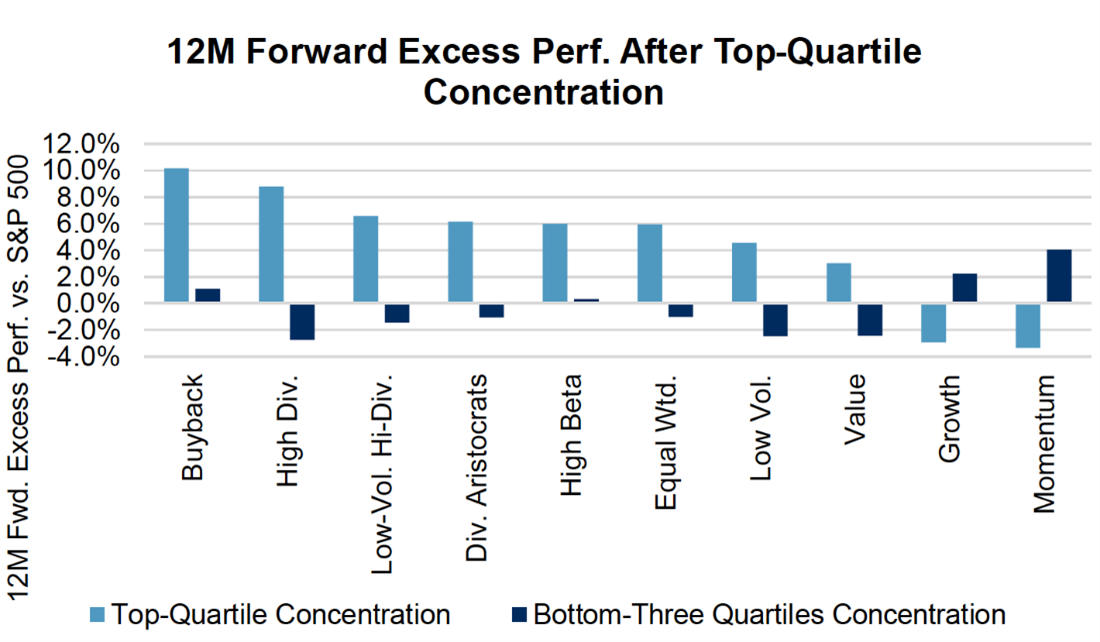
S&P Dow Jones Indices also looked at what happened after previous such occurrences. During the 12 months following the S&P 500’s concentration reaching or exceeding the 22.9% mark, strategies targeting companies that return profits to shareholders have fared well. Buyback strategies have realized the highest returns followed by high-dividend-yield and high-dividend-growth strategies.
Source: S&P Dow Jones Indices.
It Can Be Good to Be #2 or #3
While some Olympic athletes will disappoint about receiving silver or bronze medals next month, ranking number two or number three in the stock market can be a good thing. Michael Mauboussin and Dan Callahan, CFA, of Morgan Stanley found the second- and third-largest stocks at the end of a calendar year have historically gone on to outperform the largest stock.
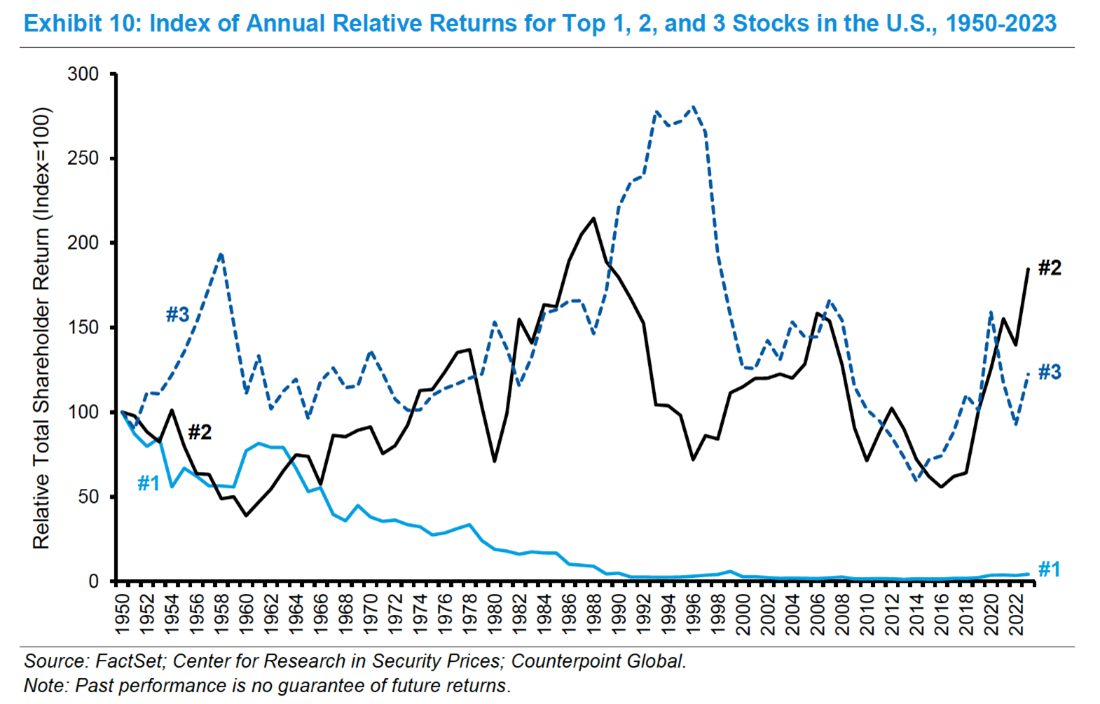
The relationship between the top three has changed between 2013 and 2023. The largest stock has outperformed the second- and third-largest stocks, though all three have still outperformed. Mauboussin and Callahan believe the change largely reflects the relative returns of the main stocks that have shuffled through the top three spots, including Apple Inc.  (AAPL), Microsoft Corp. (MSFT) and Alphabet Inc. (GOOGL).
The Elite Group of the Largest Stocks
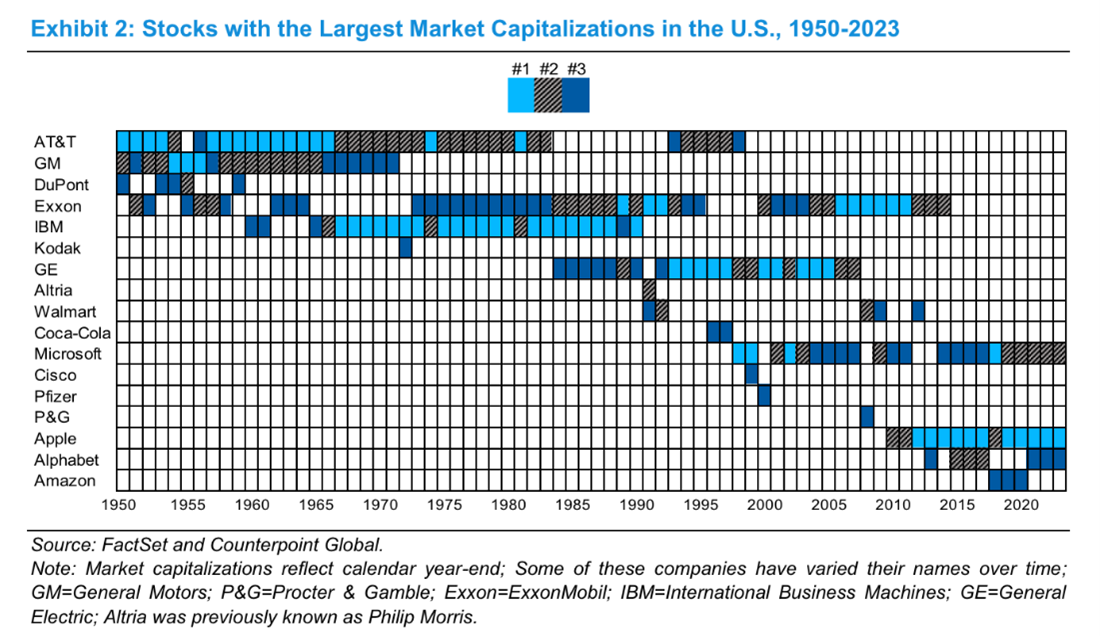
Here is one additional chart from Mauboussin and Callahan. This one plots the largest stocks in the U.S. since 1950. Just 17 stocks are on the list. Of these 17 stocks, only 11 ranked within the top three for more than two years. Four have fleetingly been number one at some point during a given year but failed to hold the top position at the year’s conclusion.
Many Stocks Are Not Participating in the Rally
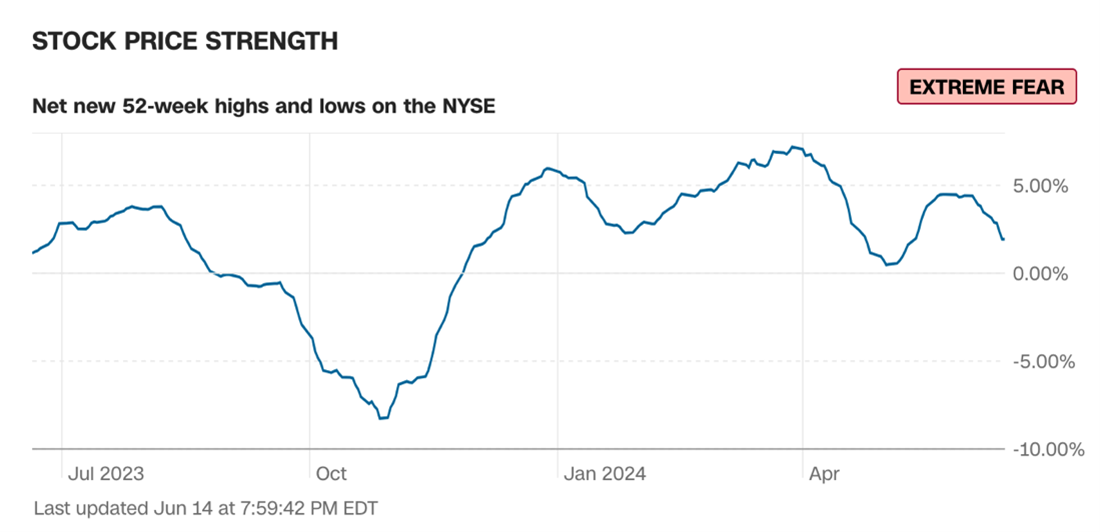
A metric strategists look at to gauge the underlying health of the market is the proportionate number of stocks trading at 52-week highs compared to those trading at 52-week lows. CNN factors this metric into its Fear & Greed index, from which I pulled this chart.
Though the market-capitalization-weighted S&P 500 is having a good June, many stocks are declining this month.
Source: CNN.
The Equal-Weighted S&P 500 Is Lagging the S&P 500
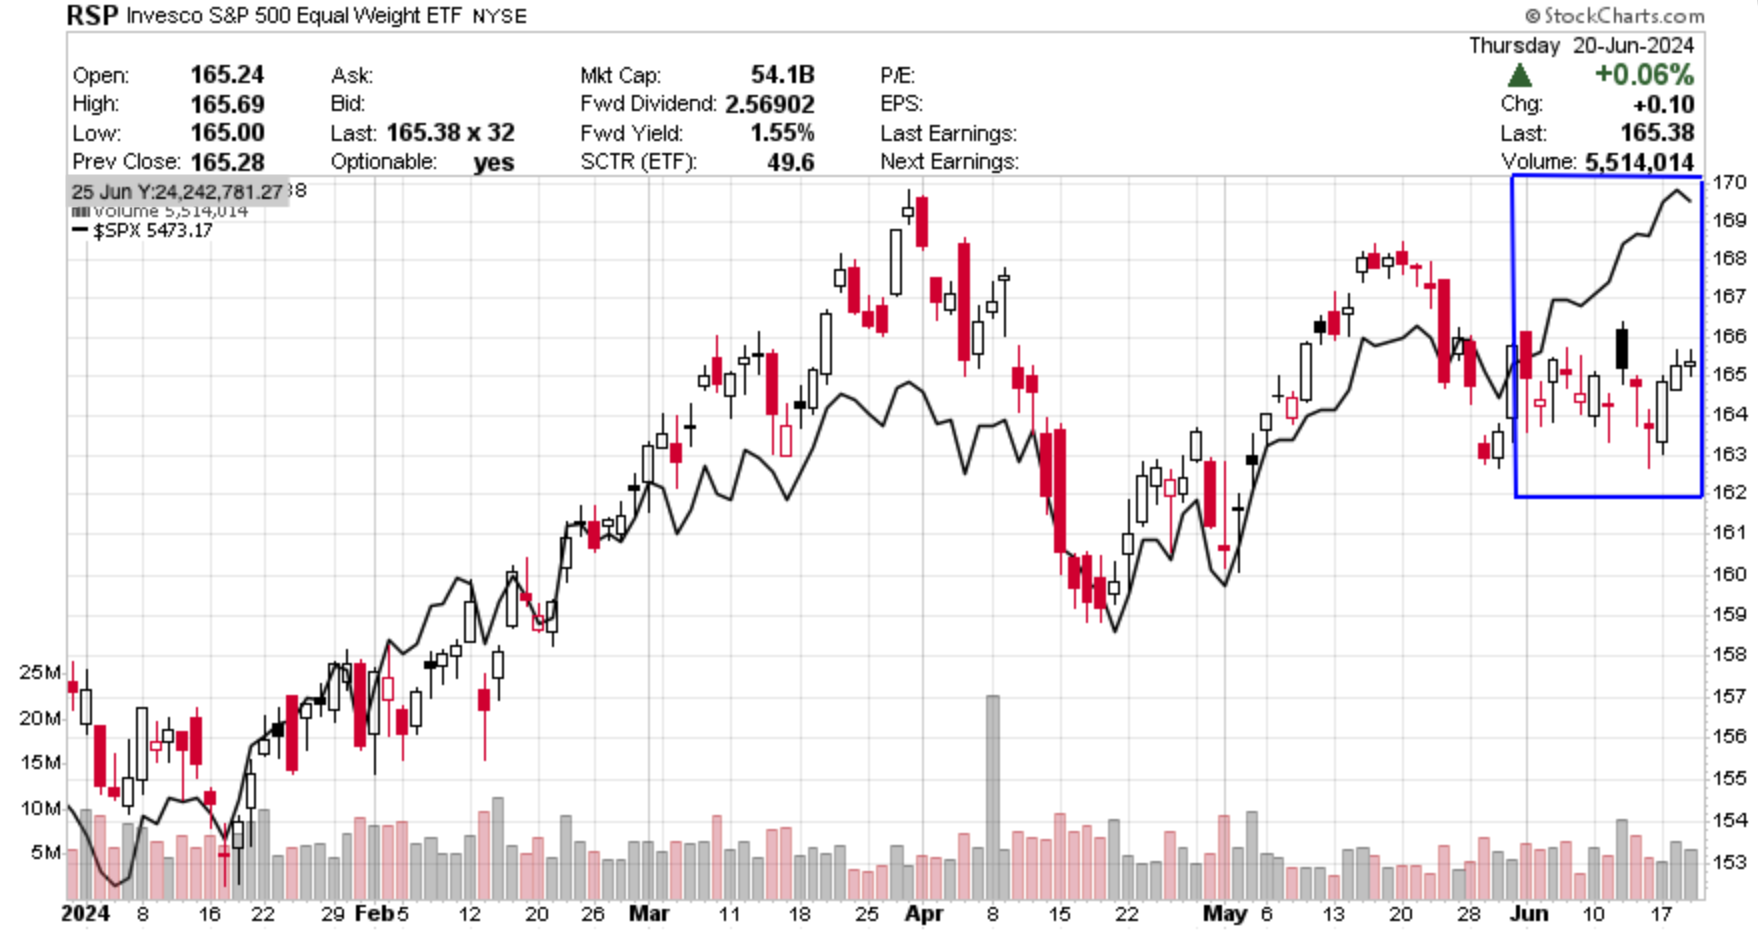
Here’s a different view of market breadth that I created on StockCharts.com. The S&P 500 Equal Weight index, represented here by the Invesco S&P 500 Equal Weight ETF (RSP), is lagging the market-cap-weighted S&P 500. Both hold the same stocks, but they weight them differently. The recent split demonstrates how just a few stocks are driving the headline market returns you see.
Source: StockCharts.com.
For Value, Look at Small-Cap Stocks
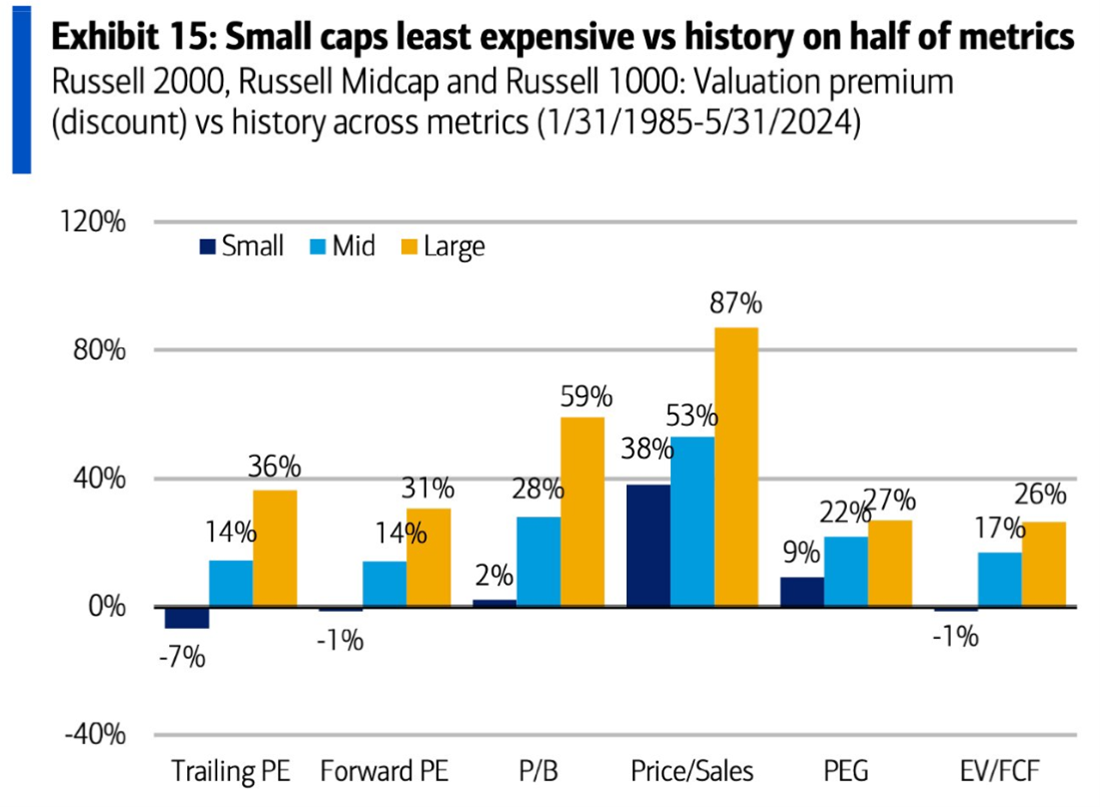
Only small-cap stocks are currently trading at or below historical valuations. BofA Global Research found that small-cap stocks are trading at a 7% discount based on current trailing price-earnings (P/E) ratios and close to average based on forward price-earnings ratios, price-to-book-value (P/B) ratios and enterprise-value-to-free-cash-flow ratios. Large-cap stocks are trading at substantial premiums across the board.
Source: BofA Global Research.
Analysts’ Buy and Sell Suggestions
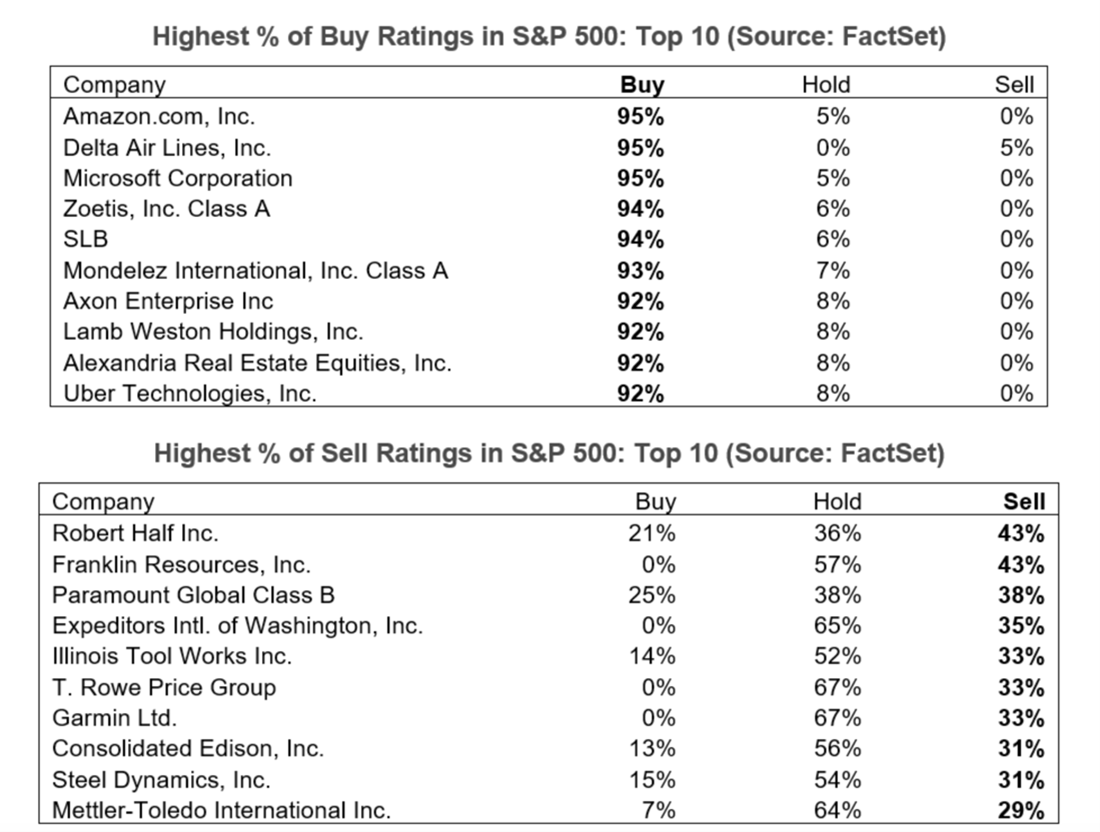
Finally, here is what analysts think will outperform and underperform going into the third quarter. Keep in mind that analysts are loath to call a stock a sell. When they do, it is often after much of the bad news has already been priced in.
Of the 11,740 ratings FactSet compiled, 54.7% are buy ratings, 40.3% are hold ratings and 5.0% are sell ratings. Do your own analysis before following any buy or sell recommendations.

-
Incorporating Equal-Weighted Funds Into Your Allocation
Equal-weighted funds hold the same securities as similar market-cap-weighted funds but in different proportions, reducing stock-specific risk. -
Gaining Small-Cap Exposure Via Mutual Funds and ETFs
How small-cap mutual funds and ETFs can add diversification to your domestic stock investments. -
Winning on Wall Street: The Martin Zweig Approach
The June AAII Journal recaps this screen that provides a robust framework for identifying growth stocks with the potential for high returns. -
A Money and Music Memoir
In her latest My Investing Discoveries blog post, Anine Sus shares her money playlist and highlights four of the songs with lessons on risk and reward, taxes, being independent and financial liberation.
AAII Sentiment Survey
Neutral sentiment among individual investors about the short-term outlook for stocks increased in the latest AAII Sentiment Survey. Meanwhile, both optimism and pessimism decreased.
Bullish sentiment, expectations that stock prices will rise over the next six months, decreased 0.2 percentage points to 44.4%. Bullish sentiment is above its historical average of 37.5% for the 32nd time in 33 weeks.
Neutral sentiment, expectations that stock prices will stay essentially unchanged over the next six months, increased 3.4 percentage points to 33.1%. Neutral sentiment is above its historical average of 31.5% for the sixth time in 14 weeks.
Bearish sentiment, expectations that stock prices will fall over the next six months, decreased 3.2 percentage points to 22.5%. Bearish sentiment is below its historical average of 31.0% for the sixth time in 10 weeks.
The bull-bear spread (bullish minus bearish sentiment) increased 2.9 percentage points to 21.9%. The bull-bear spread is above its historical average of 6.5% for the seventh consecutive week.
This week’s special question asked AAII members what they thought about the Federal Reserve’s decision to keep interest rates unchanged.
Here is how they responded:
- It was the right decision: 73.2%
- They should have raised rates: 9.9%
- They should have cut rates: 9.9%
- Not sure/no opinion: 6.7%
Bullish: 44.4%, down 0.2 points
Neutral: 33.1%, up 3.4 points
Bearish: 22.5%, down 3.2 points
Bullish: 37.5%
Neutral: 31.5%
Bearish: 31.0%
See more Sentiment Survey results.

June 13, 2024 What Two Bond Market Indicators Are Telling Investors at Midyear
June 6, 2024 Revisiting the Meme Stock Craze
May 30, 2024 Answers to Common Questions About QCDs
May 23, 2024 What Faster Trade Settlements Mean for Investors

Discussion
Barry from TX posted over 2 years ago:
Charles, you are in the running for the 2024 Paul Revere Award. Besides the obvious risks of a serious market downturn due its about 40% dependence on NVDA and 66% dependence on the Top 10 for continued momentum, there is a lurking insidious threat to some other investors who missed out on NVDA and think they have diversified their portfolios sufficiently using broad market, low-cost, high AUM ETFs. You need to check the Top 10 holdings of those ETFs. Many fund managers have invested in NVDA and the Top 10 members of the technology and communications sector leaders to balance their fund performance to their overall benchmark objectives (which is the basis for their compensation). If a downturn is coming, there are few places to hide. ETFs will fall, too. The only place where there may be some opportunity is in small-caps and mid-caps that are underperforming YTD.
You need to log in as a registered AAII user before commenting.
Create an account