

Index Fund Expense Ratios May Be Bottoming Out
by Charles Rotblut | October 12, 2023
Featured Tickers: FXAIX
IVV
SPY
SWPPX
VFIAX
VOO
FXAIX
IVV
SPY
SWPPX
VFIAX
VOO
Raymond Rondeau will share invaluable insights, unveiling “Effective Timing and Execution Approaches for Today’s Markets” and potent “Wealth-Building Strategies” at the MoneyShow on October 31, 2023! Plus, dive deeper with a special MoneyMasters course, “Evidence-Backed Strategies for Today’s Markets,” available for an additional fee. Click here for more information.
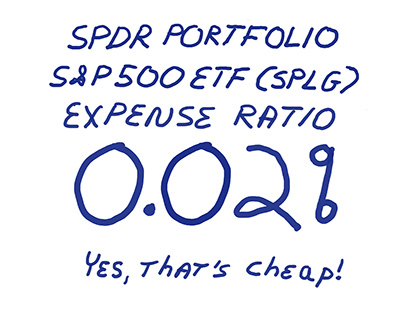
The Wall Street Journal recently speculated that expense ratios for the major index funds have reached the bottom. The call followed State Street’s reduction in the expense ratio for the SPDR Portfolio S&P 500 ETF (SPLG).
The expense ratio was cut by a single basis point from 0.03% to 0.02%. This translates to savings of $0.10 per year on every $1,000 invested. At this level, the move is more about bragging rights for State Street than it is about savings for investors.
SPDR Portfolio S&P 500 is the smallest of the four exchange-traded funds (ETFs) that directly track the S&P 500 index. Its assets under management (AUM) totaled $19.4 billion at the end of September. Its better-known brother, the SPDR S&P 500 ETF Trust  (SPY), had AUM of $401 billion at the end of September. SPDR S&P 500’s expense ratio is comparatively pricey but still cheap at 0.09% ($0.90 on every $1,000 invested).
There are two other ETFs that directly track the S&P 500. The iShares Core S&P 500 ETF (IVV) and the Vanguard S&P 500 ETF (VOO) both have an expense ratio of 0.03% ($0.30 on every $1,000 invested).
On the mutual fund side, the cheapest S&P 500 tracking funds widely available to individual investors are the Fidelity 500 Index fund (FXAIX), the Schwab S&P 500 Index fund (SWPPX) and the Vanguard 500 Index Admiral fund (VFIAX). Fidelity 500 has an expense ratio of 0.02% but must be purchased through Fidelity. Schwab S&P 500 also has a 0.02% expense ratio but can be purchased by non-Schwab clients. Vanguard 500, which I own shares of, can also be purchased by non-Vanguard clients. Its expense ratio is 0.04%. Be sure to check if there are any transaction fees if you are purchasing the Schwab or Vanguard funds in a third-party account, such as a different broker.
There are other S&P 500 mutual funds available to individual investors, but their expense ratios are 0.16% and higher.
All seven of the aforementioned ETFs and mutual funds are very close in terms of returns and risk. I used our ETF Compare tool to create the table below. The ETF Compare tool is available to all AAII members. If you click on the link, you’ll be able to see the A+ Investor Grades for these seven funds and change which ETFs and/or mutual funds are being analyzed. (There is also a Mutual Fund Compare tool, though you can use either tool to do head-to-head comparisons of mutual funds and ETFs.)
There are subtle differences between the seven funds. SPDR Portfolio S&P 500 has a 10.0% five-year annualized return versus a 9.8% return for SPDR S&P 500, for instance. This is likely due to the differences in expense ratios. The turnover rates are also slightly different.
While we at AAII favor lower expense ratios, there is a point where it may not make sense to change to a similar fund with a lower expense ratio. Paying a transaction fee to buy or sell an index mutual fund is one such reason. The transaction fee for doing so could require a balance of $500,000 or more just to break even on the first year of one basis point in savings.
Taxes are another reason. If you’ve accumulated capital gains on the S&P 500 ETFs or mutual funds you currently own, the tax liability caused by selling those shares could be far larger in terms of absolute dollars than the savings you would realize by switching to a lower-cost alternative. The math is how much you’d owe in taxes versus how much you would save in lower expense ratios. This only applies to funds held in a taxable account.
A third reason is simply behavioral. It’s far more important to focus on having the right allocation for your goals and the ability to withstand volatility than it is to dwell on whether to switch from a fund with a 0.04% expense ratio to one with a 0.02% or 0.03% expense ratio. You also need to consider whether logging in to your brokerage or mutual fund account will prompt you to make other changes that you wouldn’t otherwise make because of how you feel about the market or certain investments right now. It’s easier to stay disciplined when temptation isn’t staring you right in the face.
All this said, if you are holding a large-cap mutual fund or ETF with a considerably higher expense ratio, it may make sense to take advantage of the cost savings. The expense ratios on these funds are now nearly as low as they can possibly go.


-
Understanding Mutual Fund Fees and Expenses
While it is natural to focus on the performance track record when selecting a fund, expenses and fees can have a dramatic impact on your realized rate of return. -
Comparing Funds That Track the Same Index
Although index mutual funds and ETFs seek to mimic the composition and performance of an index, they are usually not exact copies of the index itself. -
Tweaking Benjamin Graham’s Enterprising Investor Screen
The adjusted Graham enterprising screen averaged 24 passing companies compared to seven for the current screen. -
How to Open a Brokerage Account
Fees, more than anything, will affect your long-term returns, so pay close attention to them when choosing your broker. -
Retiring Early: Memoir or Fiction?
In her latest My Investing Discoveries blog post, Anine Sus examines what exactly is required if you want to aim for an early retirement.
AAII Sentiment Survey
Optimism among individual investors about the short-term outlook for stocks rose to its highest level in five weeks in the latest AAII Sentiment Survey. Meanwhile, pessimism fell but remains above average.
Bullish sentiment, expectations that stock prices will rise over the next six months, rose 9.9 percentage points to 40.0%. Optimism was last higher on September 7, 2023 (42.2%). Optimism is above its historical average of 37.5% for the second time in six weeks.
Neutral sentiment, expectations that stock prices will stay essentially unchanged over the next six months, fell 4.8 percentage points to 23.5%. Neutral sentiment is below its historical average of 31.5% for the third time in nine weeks.
Bearish sentiment, expectations that stock prices will fall over the next six months, fell 5.1 percentage points to 36.5%. Pessimism is above its historical average of 31.0% for the sixth time in eight weeks.
The bull-bear spread (bullish minus bearish sentiment) skyrocketed 15.0 percentage points to 3.5%. Even with the jump, the bull-bear spread remains below its historical average of 6.5% for the fifth time in six weeks.
This week’s special question asked AAII members what impact the rise in bond yields has had on their shorter-term outlook for stocks. Here are their responses:
- Made me more cautious/bearish: 29.6%
- I’m considering rotating, at least partially, out of stocks and into higher-yielding alternatives: 26.6%
- Made more me optimistic/willing to look for potential bargains among stocks: 13.3%
- No impact: 27.2%
- Other/no opinion: 3.0%
Bullish: 40.0%, up 9.9 points
Neutral: 23.5%, down 4.8 points
Bearish: 36.5%, down 5.1 points
Bullish: 37.5%
Neutral: 31.5%
Bearish: 31.0%
See more Sentiment Survey results.

October 5, 2023 Financial Independence and Retirement
September 28, 2023 James Cloonan's 10 Commandments for Investing
September 21, 2023 September Charts of Interest: Some Stocks Stay Expensive
September 14, 2023 Current Valuation Ranges for Stocks

Discussion
Barry from TX posted over 2 years ago:
Thanks, Charles, for the side-by-side, apples-to-apples comparisons on these 7 funds that track the S&P 500 index. When I compared the data for the 11 measures provided in the table --- the 7 measures of RETURN (5-Yr, 3-Yr, 1-Yr, 3-Mo, 1-Mo, and YTD), the 2 indexed measures of RISK (Category Risk and Total Risk), 1 measure of LIQUIDITY, Turnover, and 1 measure of COST, Expense Ratio —the individual and overall differences among these 11 key factors are so small as to be indistinguishable. However, some factors provided only in the text reveal disparities that may matter. Data for relative size – assets under management (AUM) – vary considerably. Larger funds provide higher liquidity and may help lower price spreads when buying and selling thus reducing total costs. Inception dates demonstrate tenure and may show stability. These data vary from 30 years (SPY) to 12 years (FXAIX). Finally, these 7 funds are provided by 5 very different companies – with differing lengths of tenure, varying sizes of their offering, and large differences in market shares. Jack Bogle and Vanguard have the longest tenure in mutual funds. State Street SPDR has the longest tenure in the ETF business. Blackrock iShares has the largest overall market share in funds under management. SCHW and Fidelity are relatively newer offerings and have smaller market shares. These factors were not discussed but may matter to some investors. I hope this information helps other members.
You need to log in as a registered AAII user before commenting.
Create an account