


Related
Investor Professor
Charles Schwab offers funds that could make suitable options for AAII’s Asset Allocation Models.

The AAII Asset Allocation Models can be followed with no-load mutual funds and exchange-traded funds (ETFs) from the Charles Schwab family. We discuss options with low expense ratios and returns that exceed their category average. The AAII Asset Allocation Models provide sample allocations based on an investor’s time horizon and ability to withstand short-term market volatility. The models incorporate stocks, bonds and cash to build an allocation strategy.
Previous articles on the AAII Asset Allocation Models have explored mutual funds and ETFs from various fund families. The rationale for exploring funds from different fund families that can be used to follow these models is to provide options for those who face investment choice limitations or prefer a specific fund family. We’ve explored model allocations using BlackRock, Fidelity, T. Rowe Price and Vanguard funds. We also offered suggestions for tilting the models by utilizing index funds that focus on growth or value styles or using equal-weight index funds.
We are now adding Schwab funds to this analysis. For over 50 years, Charles Schwab has positioned itself as a company that offers low-cost, accessible financial products. The combined assets of Schwab mutual funds and ETFs included in our database total $606.5 billion as of September 30, 2024. Its mutual funds and ETFs are known for low expense ratios, diversification, and depth and breadth of choices.
Using the same criteria as we did for other fund families, we required mutual funds to be identified by Morningstar as true no-load funds and open to new investors. All 61 Schwab mutual funds in our database are labeled as “other” class shares by Morningstar, although none of them have loads or are closed to new investors. None were classified as institutional, advisor, retirement or S class shares.
Additionally, none of the Schwab mutual funds discussed here have a minimum purchase requirement. They can be purchased by individual investors directly through a Schwab brokerage account at no fee. When conducting the research for this article, we noticed that Fidelity charges transaction fees for purchasing any of the Schwab mutual funds. We do not know if this is the case for other non-Schwab brokerage firms, but we encourage you to check if you are interested in one or more of these funds.
Returns for the year-to-date, three-year and five-year periods were required to rank in the range of 40% to 100% for their category. We considered a larger group of mutual funds by relaxing what might seem to be a return range below what we would advocate for inclusion in the AAII Asset Allocation Models.
Equity categories for the mutual funds and ETFs include blend, growth, value, foreign and diversified emerging markets. Listing both growth and value funds, when available, helps provide choices to those investors who wish to tilt their portfolios toward either style. A short-term fixed income ETF is also included.
Table 1 presents the Schwab mutual funds that could be used to follow one of AAII’s allocation models.

Of the three mutual funds in the large blend category, the Schwab S&P 500 Index fund  (SWPPX) is the most widely held per assets under management (AUM). It is followed by the Schwab Total Stock Market Index fund (SWTSX) and then the Schwab 1000 Index fund (SNXFX) in size.
The Schwab S&P 500 Index is a classic large blend index fund that tracks the return of the S&P 500 index. Its top 10 holdings comprise 35.8% of the total portfolio assets and include familiar holdings such as Microsoft Corp. (MSFT), Nvidia Corp. (NVDA), Apple Inc. (AAPL) and Amazon.com Inc. (AMZN). The fund is overweighted in the information technology sector (32.4%).
The Schwab Total Stock Market Index casts a wider net, providing exposure to the entire U.S. stock market and holding 3,308 stocks. Its top 10 holdings mirror that of the Schwab S&P 500 Index and represent 31.3% of the portfolio. Sector weightings are not significantly different, but investors will gain exposure to small- and mid-cap stocks.
The Schwab 1000 Index fund tracks Schwab’s proprietary Schwab 1000 index. This index includes the largest 1,000 U.S. common equity stocks. The sectors represented and the top 10 holdings are similar to those of the other two large blend funds.
All three mutual funds have below-average expense ratios (cheap), with A+ Investor Grades of A. The Schwab S&P 500 Index’s expense ratio of 0.02% is among the lowest in the universe of mutual funds and ETFs that track the S&P 500. The Vanguard 500 Index Admiral fund (VFIAX), for example, has an expense ratio of 0.04%. The Schwab S&P 500 Index also has the best A+ Investor Grades for return over the year-to-date, three-year and five-year periods among the large blend mutual funds shown. Launched in May 1997, this is one of Schwab’s first mutual funds.
Two mutual fund choices exist in the large growth category: The Schwab U.S. Large-Cap Growth Index fund (SWLGX) and the actively managed Schwab Large-Cap Growth fund (SWLSX). These two growth-oriented funds have greater exposure to mega-cap technology companies like Apple, Microsoft and Nvidia than the large blend funds do. Health care company Eli Lilly & Co. (LLY) is also among the top 10 holdings in both of these funds. The 10 largest holdings represent 60.4% of the Schwab U.S. Large-Cap Growth Index and 54.6% of the Schwab Large-Cap Growth—a high level of concentration.
The Schwab U.S. Large-Cap Growth Index tracks growth stocks within the Russell 1000 Growth index. Its expense ratio is 0.04%.
Due to active management, investors will pay a 0.99% expense ratio for the Schwab Large-Cap Growth fund. It strives to offer long-term growth while sticking with companies included in the S&P 500.
Both funds have similar total risk index values at 1.38 and 1.33, respectively. However, their category risk indexes are slightly below average at 0.97 and 0.93. The total risk index compares the standard deviation of returns for a given fund with that of all funds in the universe, whereas the category risk index compares a fund to its peers. Values below 1.0 indicate lower risk and those above 1.0 signal higher risk.
The Schwab Fundamental U.S. Large Company Index fund (SFLNX) is a standout among large-cap value funds, with A+ Investor Grades of B, A and A for its year-to-date, three-year and five-year returns the periods, respectively. These are the same grades earned by the Schwab U.S. Large-Cap Growth Index. The large-cap growth fund has higher year-to-date and five-year returns because growth stocks have been outperforming value stocks.
The Schwab Fundamental U.S. Large Company Index tracks the RAFI Fundamental High Liquidity U.S. Large index. This index weights companies based on their adjusted sales, retained operating cash flow and combined dividends and stock buybacks. The alternative weighting scheme currently results in the fund’s largest exposure (18.3%) going to the financial sector. Though Apple and Microsoft are still the largest holdings, Exxon Mobil Corp. (XOM) and Walmart Inc. (WMT) are also among the 10 top largest holdings.
The fund has the lowest total risk index of the Schwab stock funds included in Table 1, at 1.12.
The Schwab U.S. Mid-Cap Index fund (SWMCX) is a mid-cap blend index fund. It tracks the Russell Mid Cap Total Return index, which consists of the smallest 80% of companies held within Russell 1000 index. Industrials (17.0%) and financials (15.4%) make up the biggest sector weightings in the fund. With 800 holdings, the largest 10 holdings only comprise 4.7% of the portfolio. Its expense ratio is just 0.04%.
The actively managed Schwab Small-Cap Equity fund (SWSCX) has delivered above-average historical performance. It is designed to offer potential for long-term performance that will outperform the Russell 2000 index. The expense ratio of 1.09% is the highest in Table 1 but is average for the small blend category (grade of C). Its total risk index of 1.41 is high and reflects the volatility of small-cap stocks.
The fund’s portfolio management team uses proprietary research to evaluate and select securities based on three components: fundamentals, valuation and sentiment. Health care, industrials and financials are the most represented sectors among the fund’s 316 holdings.
Both of the foreign large blend funds shown in Table 1 track the MSCI EAFE index. They differ by management style.
The Schwab International Core Equity fund (SICNX) is actively managed. Sectors are underweighted or overweighted relative to the MSCI EAFE index in an attempt to outperform the index. On the other hand, the Schwab International Index fund (SWISX) closely tracks the index and its sector weightings. Japan, the U.K. and France account for the largest country exposures in both funds, though the percentage is slightly different between the two funds.
Novo Norodisk A/S (NVO) is the top holding in both portfolios. The Schwab International Index is more diversified with five times as many stocks (745 versus 143). Again, investors will pay more for active management, as the Schwab International Core Equity has the higher expense ratio of 0.86%.
The Schwab Fundamental Emerging Markets Equity Index fund (SFENX) tracks the RAFI Fund High Liquidity Emerging Markets index. Over one-third of the fund’s portfolio (37.1%) is allocated to China. Though this is an index fund, it is not market-capitalization weighted. Rather, it follows a contrarian index that provides exposure to both the value and yield factors. Fundamental measures are used to select, weight and rebalance the index.
Schwab has been in the ETF business for 15 years. The first group of ETFs was launched in November of 2009. Three of those ETFs—the Schwab International Equity ETF (SCHF), the Schwab U.S. Broad Market ETF (SCHB) and the Schwab U.S. Large-Cap ETF (SCHX)—are included in Table 2. All of the Schwab ETFs shown are passively managed. All but three have A+ Investor Grades of A for expense ratio.
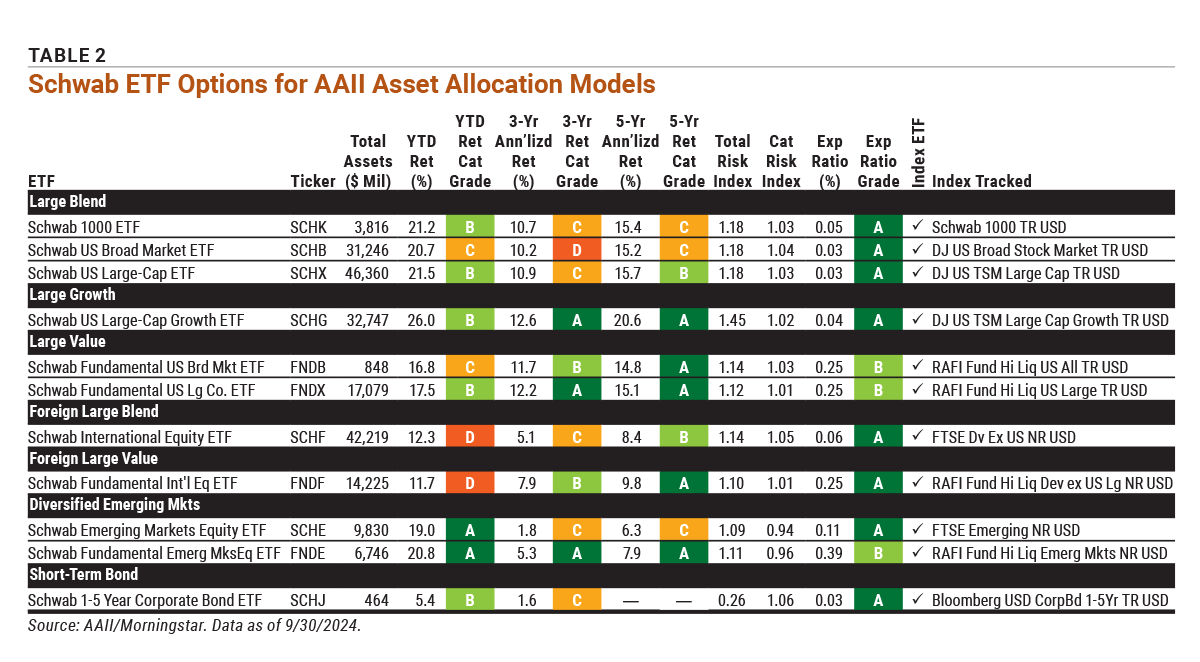
We generally suggest avoiding ETFs with A+ Investor Grades of D for performance. Exceptions can be made when the number of ETFs in a category is small, the absolute difference in returns is not large and the ETF is tracking a broad-based index.
A handful of ETFs suggested as proxies for the AAII Asset Allocation Models have a D grade for one of the return periods: the Schwab U.S. Broad Market, the Schwab International Equity and the Schwab Fundamental International Equity ETF (FNDF). The Schwab U.S. Broad Market’s D grade is for its three-year return of 10.2%. However, this is just 0.1 percentage points below the 10.3% average three-year return for the ETFs in the large blend category.
The three large blend ETFs provide different strategies and below-average expense ratios. The Schwab U.S. Large-Cap is a way to gain access to the 750 largest U.S. companies as ranked by market cap by tracking the Dow Jones U.S. Large-Cap Total Stock Market index.
The Schwab U.S. Broad Market accomplishes large-cap exposure by tracking the Dow Jones U.S. Broad Stock Market index. This index contains 2,500 stocks. Notably, both Alphabet Inc. Class A (GOOGL) and Alphabet Class C (GOOG) shares are included in this ETF’s top 10 holdings.
The Schwab 1000 ETF (SCHK) is the ETF version of the Schwab 1000 Index mutual fund. The returns and the 0.05% expense ratio are the same for both the mutual fund and the ETF. The A+ Investor Grades for the returns differ due to differences between the funds included in the respective category groups.
Generally, sector weightings in these three ETFs are similar to those of the aforementioned large blend mutual funds.
Investors might use the Schwab U.S. Large-Cap Growth ETF (SCHG) for their large-cap growth style needs. Performance over the year-to-date, three-year and five-year periods is above average and the expense ratio is below average. Its total risk index of 1.45 is the highest in Table 2. As would be expected, sector weightings are tilted to information technology (48.7%) and communication services (13.6%).
The Schwab Fundamental U.S. Large Company ETF (FNDX) and the Schwab Fundamental U.S. Broad Market ETF (FNDB) track similar fundamentally driven RAFI indexes. The Schwab Fundamental U.S. Large Company holds 738 large- and mid-cap companies. The Schwab Fundamental U.S. Broad Market ETF holds 1,731 large, mid- and small-cap stocks.
The Schwab International Equity and the Schwab Fundamental International Equity target large- and mid-cap companies in developed countries. The Schwab International Equity’s biggest country exposures are to Japan, the U.K. and France. Japan, the U.K. and Germany are the Schwab Fundamental International Equity’s largest country exposures.
Year-to-date performance is weak for both ETFs compared to their category averages, while five-year performance is above average. Expense ratios are below average at 0.06% and 0.25%, respectively.
The Schwab Fundamental Emerging Markets Equity ETF (FNDE) is the only ETF in Table 2 that earned A+ Investor Grades of A across all performance periods shown. It has a below-average expense ratio of 0.39%. China and Taiwan are its biggest country exposures. The Schwab Emerging Markets Equity ETF (SCHE) tracks the FTSE Emerging Markets index. It invests in over 20 emerging market countries, with the largest exposures in China and India. Both emerging markets ETFs are heavily weighted toward the financials and information technology sectors.
The sole fixed income choice is the Schwab 1-5 Year Corporate Bond ETF (SCHJ). This ETF invests with exposure to shorter-term corporate bonds. The portfolio has the largest weight by effective maturity to the one-to-three-year time period (54.5%), followed by the three-to-five-year time period (44.8%). Its biggest sector allocations are to industrials (49.2%) and financials (44.1%). The ETF was incepted on October 10, 2019, and had not quite reached its five-year anniversary when we pulled the data. The total risk index is 0.26, the lowest in Table 2 as one would expect for this type of fund.
AAII members have access to portfolio and performance data through the Fund and ETF Evaluators. You can use these tools as a starting place to learn more about the fund or ETF’s characteristics. Type the fund’s name or ticker in the search box at AAII.com and then choose the fund from the drop-down list. Those interested in learning more about asset allocation and the AAII Asset Allocation Models can visit www.aaii.com/asset-allocation.
Other articles in this series found on AAII.com:
Using Fidelity Funds to Fill Your Asset Allocation Needs, September 2023
Index Fund Options for AAII’s Asset Allocation Models, November 2022
Investor Professor

AAII How-To

AAII InvestoGraphic

BARRY J from TX posted almost 2 years ago:
ROBERT A from NC posted almost 2 years ago:
ROBERT A from NC posted almost 2 years ago:
You need to log in as a registered AAII user before commenting.
Log InCreate an account